Advisor Guide: Creating Your First Plan
This guide will walk you through the process of creating your first plan(s) with Adviice. It goes through every section, highlights what clients will see and how best to take advantage the platform.
We recommend you work through each section with the Client Portal open so you can best understand how both you and your client will experience Adviice.
Table of Contents:
- Advisor Overview: How Financial Planning Works in Adviice
- Discovery Phase
- Foundation Phase
- Planning Phase
- Adding a Rental Property
- Adding a Corporation
🧭 Advisor Overview: How Financial Planning Works in Adviice
As an advisor using Adviice for the first time, it’s helpful to understand how the platform is structured before you begin building or reviewing a client’s plan. Adviice breaks financial planning into three distinct phases that guide both you and your client through a logical, step-by-step process — from data gathering to strategy implementation.
🔍 1. Discovery Phase – Collect Context and Facts
This is where every plan begins. You’ll walk through structured sections to gather:
- Personal and household details (age, dependents, retirement goals)
- Income and Expenses
- Financial assets, liabilities, income sources
- Account types (RRSPs, TFSAs, pensions, etc.)
- Insurance coverage
- Corporate/Rental Information
The Discovery phase also includes a Goals & Values section, where clients reflect on what’s most important to them.
🧱 2. Foundation Phase – Define the Planning Strategy
Once the core information is in, the Foundation phase shifts the focus to assumptions, risks, and planning opportunities. You’ll explore:
- Debt management and emergency fund strategy
- Investment planning and asset mix
- CPP/OAS estimates and timing
- Tax planning considerations
- Future cash flow needs and spending goals
This is where you start shaping the plan — not with projections yet, but by identifying key decisions and areas of opportunity.
📈 3. Planning Phase – Run Projections and Apply Strategies
The final phase is where the real power of the platform kicks in:
- Generate projections based on the inputs and assumptions
- Test different withdrawal strategies (RRSP vs TFSA vs non-reg)
- Adjust CPP and OAS timing
- Review implementation steps and action items
- Help clients make informed trade-offs and timing decisions
This is where the strategy becomes tangible — where you can collaborate with clients to fine-tune their path forward.
✅ Before You Start: Review the Profile Settings
The Profile section controls many platform-level assumptions.
The structure of the platform is custom built for each client based on their answers to the onboarding questions. It will only show fields for account, income, insurance types that they have indicated that they have. If you find things have been missed you can always activate them in the Profile section.
Double-check:
- Date of birth, retirement age, and residency
- Whether the client has dependents
- What types of accounts, insurance, and assets are in place
- Do they have rental properties or corporations? Have those been activated?
- Are they already receiving CPP/OAS?
- Any special circumstances (e.g. recent immigration, partial pensions)
This ensures Adviice gives the most accurate and relevant recommendations throughout the process.
💡 Advisor Perspective:
Think of the three phases as building a narrative:
- Discovery tells you who the client is
- Foundation reveals what’s possible
- Planning delivers how to make it happen
Adviice is designed to make the process intuitive for clients and deeply flexible for advisors — giving you both the insight and control to build smart, values-aligned retirement plans.
👥 Goals & Values
As an advisor, the first section you’ll see in the Discovery phase is Goals & Values. This step is designed to give you a more holistic view of your client’s mindset, priorities, and financial wellbeing — before diving into the hard data.
💬 What Your Client Will See:
This section presents a set of open-ended, reflective prompts that encourage clients to think about:
- What’s currently working in their financial life
- What challenges or uncertainties they’re facing
- What retirement means to them — both financially and personally
- Their big-picture hopes and concerns
It’s intentionally qualitative, not numerical. The goal is to capture the emotional and lifestyle drivers that will shape their retirement planning.
🧭 Why This Matters for You as an Advisor:
This section helps you:
- Start the planning relationship with empathy and context
- Uncover priorities that may not show up in a spreadsheet (e.g. flexibility, peace of mind, family support)
- Tailor your recommendations more meaningfully
- Anchor future strategy conversations in what really matters to the client
Even if a client hasn’t worked with a financial planner before, the exercise of writing down their values and goals helps them arrive at planning discussions more focused and self-aware.
❌ Disable This Section:
If this section is not valuable to you or your clients it can be disabled using the Planner Portal. Keep in mind this will disable the page for all your clients.
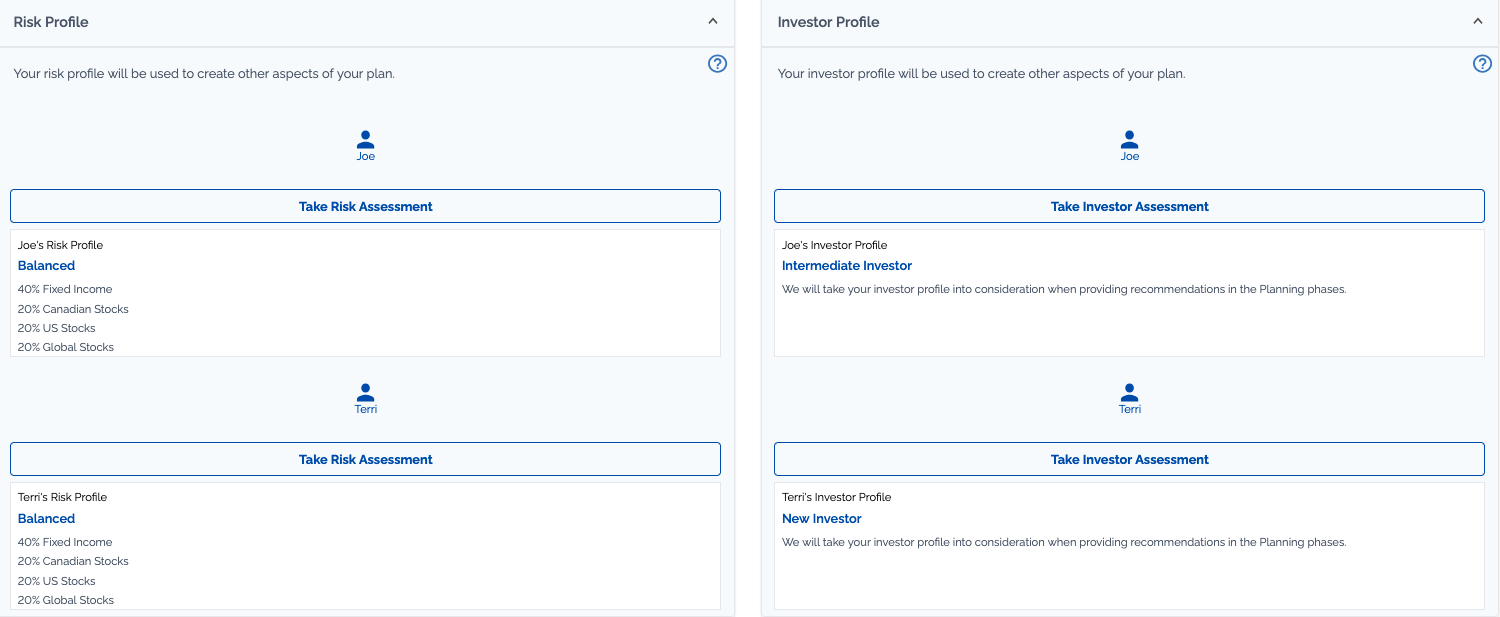
👥 Discovery Phase – Step 2: Risk & Investor Profile
In this step of the Discovery phase, your client completes a brief questionnaire to help clarify two important elements:
- Risk tolerance — their emotional and financial ability to handle market volatility
- Investor knowledge — their comfort level and experience with investing decisions
📋 What the Client Sees:
The questionnaire is quick — usually just a few minutes — and consists of straightforward multiple-choice prompts. Once completed, the client receives a summary of their risk profile and investor type (e.g., conservative, balanced, growth-oriented).
🧩 How This Informs Planning:
While this section doesn’t set asset allocation directly, it acts as a reality check:
- Does their current or proposed investment strategy align with their stated risk tolerance?
- Are there gaps in knowledge that may require education or simplified planning strategies?
- Does their profile signal any potential mismatches with long-term assumptions?
Use this information to guide your conversations around asset mix, drawdown strategy, and portfolio structure later in the plan.
✅ Advisor Tip:
If the risk profile and investor knowledge seem misaligned with a client’s actual portfolio, flag it early. This is often where planning and coaching intersect — especially with DIY investors who may not have revisited their risk profile in years.
❌ Disable This Section:
If this section is not valuable to you or your clients it can be disabled using the Planner Portal. Keep in mind this will disable the page for all your clients.
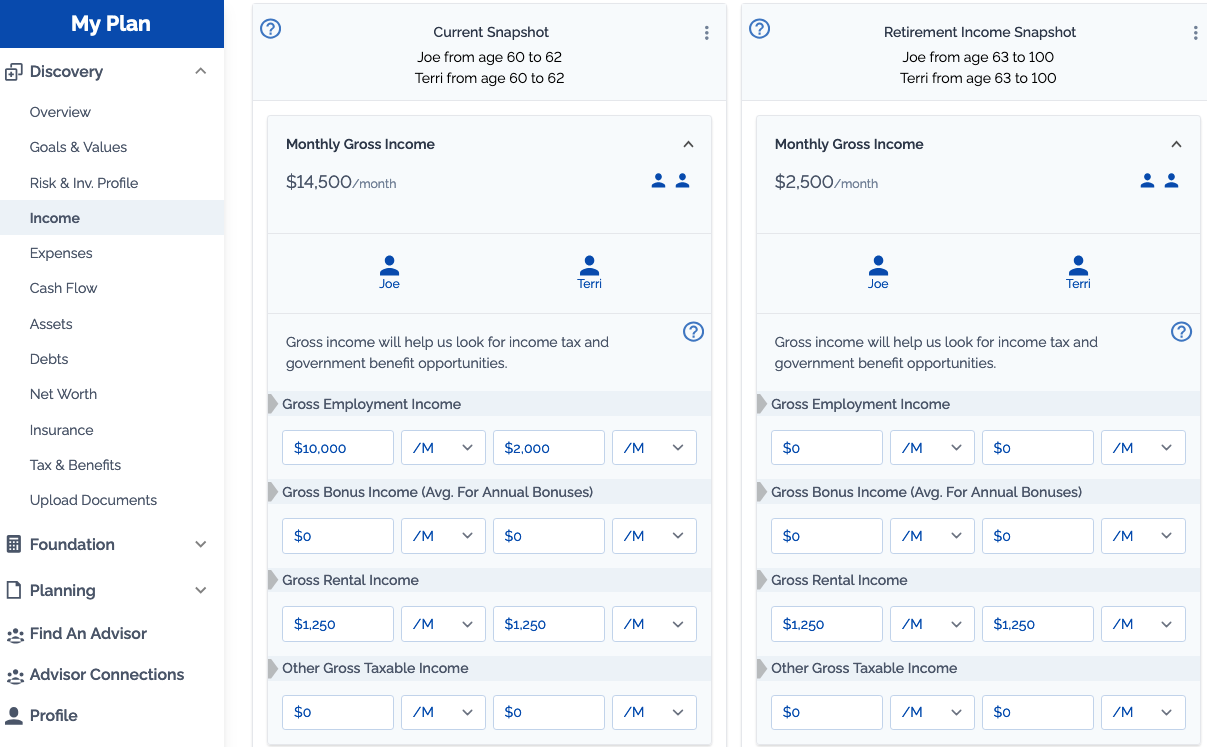
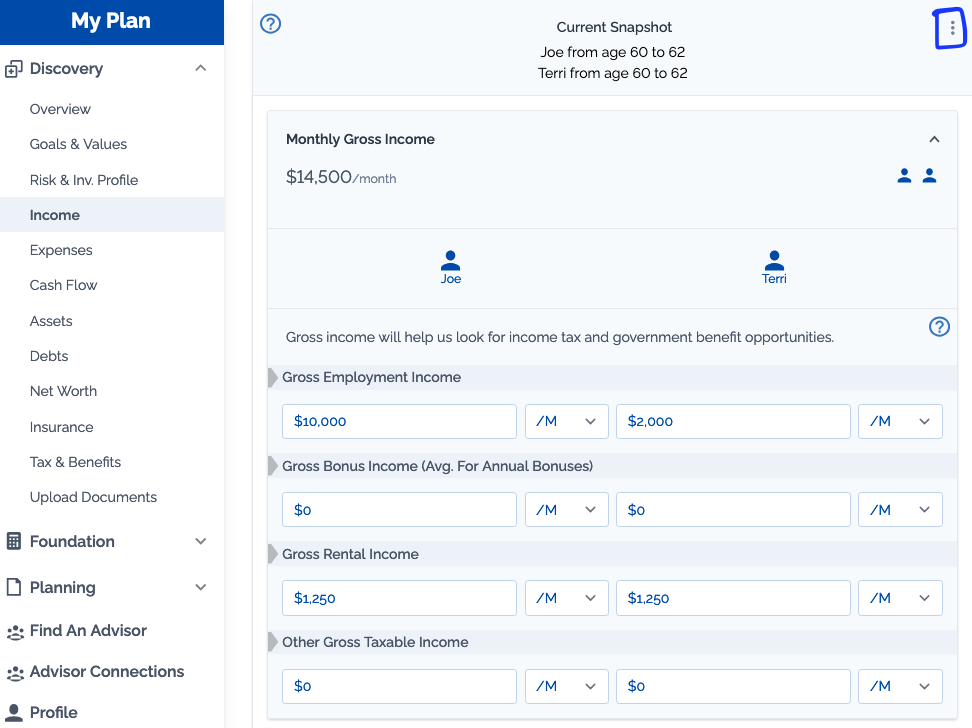
👥 Income
In this section, clients will input earned income only — not investment or pension income — to establish the foundation for their retirement plan.
💼 What’s Captured:
- Employment income (full-time, part-time)
- Bonus Income
- Self-employment income
- CPP and OAS benefits (once started)
- Rental Income (if any)
- Corporate Draws (if any)
This is about pre- and early-retirement earned income, not decumulation income streams like RRSP withdrawals, defined benefit pension or investment income. These will be entered in other sections:
- Pension: Added in the Tax & Benefits section. Whether the client is receiving your pension or not, enter the information in the Tax & Benefits section.
- Investment Withdrawals: Automatically calculated in the Projections Section.
- Lump Sum Income: If there are single year sources of income (eg: inheritance) you will want to enter those in either Future cashflow or the Projections Section
If any income fields are missing from the Income Section (CPP, OAS, Rental Income) it can be added in the Profile Section.
🧾 What the Client Enters:
- Gross employment/self-employment income
- Known deductions (DB pension contributions, insurance premiums, etc.)
- Net income (used only for cash flow display, not projections)
The platform will recalculate tax, CPP, and EI based on entered gross income — so precision isn’t critical here.
🧾 How to Create Additional Snapshots
- Click on the menu button in the right hand corner of any existing income snapshot
- Add a descriptive name for your new income snapshot
- Add the start age (for couples this is the primary user)
- Add the end age (for couples this is the primary user)
- Click "Create
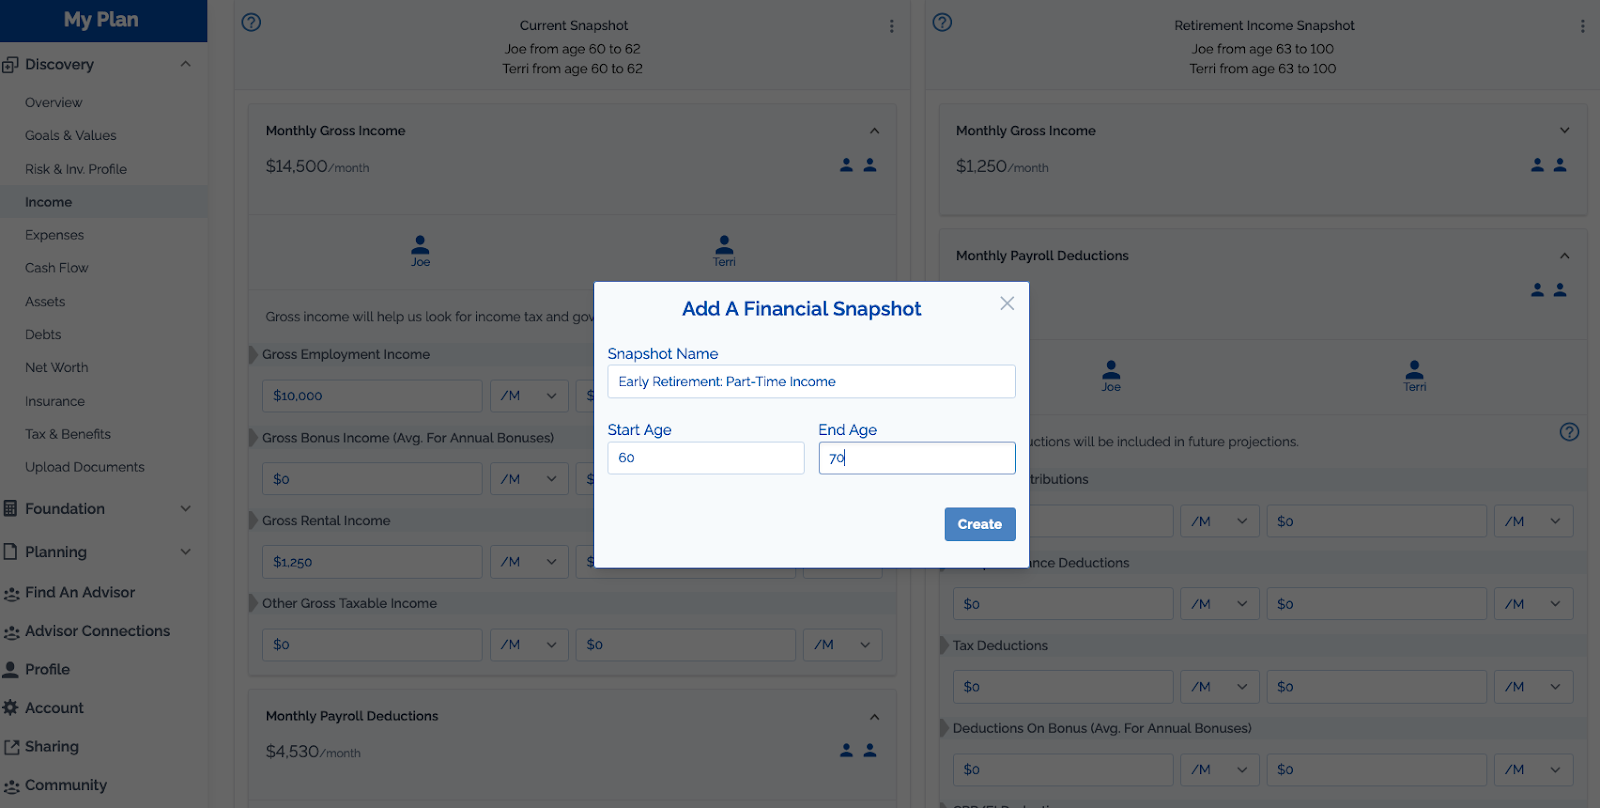
Tip: After adding a new snapshot it may be necessary to change the ages for other snapshots. This will not happen automatically.
🔍 Planning Considerations:
- Encourage clients to enter broad phases of income (e.g., full-time to age 55, part-time from 56–57).
- If non-taxable income is expected regularly have them include it so it appears in their initial cash flow diagram. This should NOT include amounts that will be recalculated in Projections (like Child Benefits and Government Benefits, Taxes, CPP/EI contributions
- No need to enter DB pension income or investment income at this point — those are handled later in the plan.
🧠 Advisor Tip:
Use this section to spot:
- Major income transitions (e.g., phased retirement)
- Potential mismatches between expected earned income and future expenses
- Early signs of benefit eligibility or planning opportunities (e.g., OAS clawback zones)
- For an income/expense entry shortcut, view this resource on creating a quick plan with Adviice
- Gross income is required by the platform for projections, but net income is not. Net income is used to generate the Cash Flow chart. If the client is unable to calculate net income, this can be skipped.
- Deductions are also mostly optional. CPP/OAS and Tax are all recalculated in the Planning Section. The only essential deductions to add are for any workplace pensions.
📍 Reminder:
All figures should be entered in today’s dollars. The platform will apply inflation adjustments in projections.
🛠️ Troubleshooting:
- How to Enter Income as a Retiree?
- How Do I Get Rid of 'Missing Gross Income on the Cash Flow Diagram?
- Where do I Enter Investment Withdrawals in the Income Section?
- How to fill in Income Section in Discovery if I have no Employment Income
- Where Do I Enter CPP/OAS Income If I'm Already Receiving Benefits?
- How Do I Model Different Retirement Ages Between Spouses?
- How To Add Part-Time Income in Retirement
- How Do I Fix Age Gap/Overlap Errors (Error 228,192,522 and 668)
- How to Include an Inheritance in my Plan
- Are Group RRSP/DC Pension deductions considered as Pension Contributions?
More help articles can be found here.
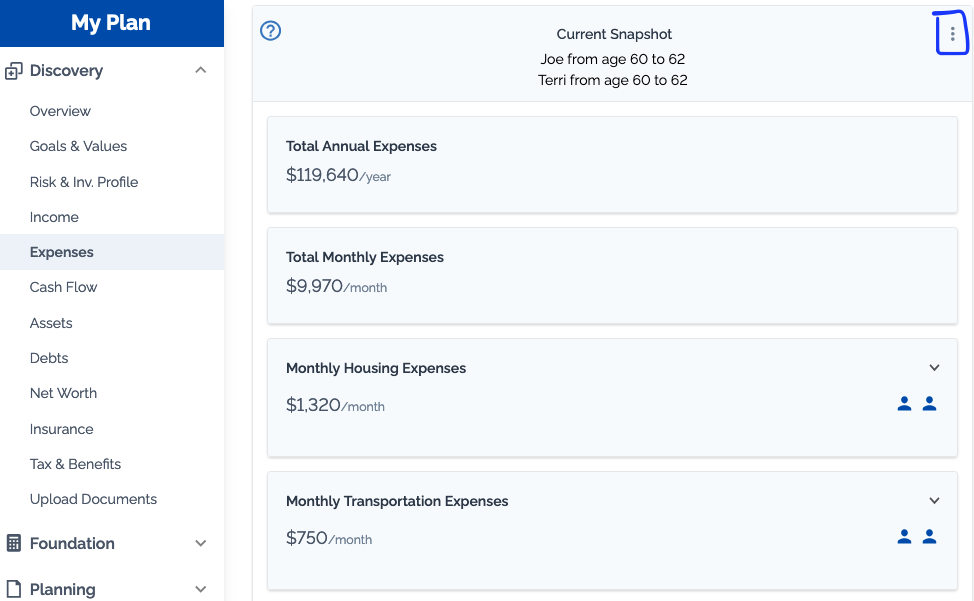
👥 Expenses
In this section, clients can set up multiple phases of spending throughout the plan. These snapshots are meant to capture broad lifestyle shifts, not year-by-year detail.
🏠 Current Spending Phase
Clients start by building their Current Spending Snapshot—this is their spending today. They’ll enter details for:
- Housing Expenses
- These expense fields will shift for renters vs home owners
- Transportation Expenses
- These expense fields will shift depending on whether the client indicated they own a vehicle
- Personal Expenses:
- These expense fields are consistent for all clients
- Savings & Debt Payments:
- These fields will change depending on the types of debt and savings accounts the client indicated in their profile
- Rental Property Expenses:
- For each indicated rental property there will be a separate area for expenses
- Seeing Adding a Rental Section of this Guide for more details
📆 Adding Spending Snapshots
Clients can then add additional snapshots based on broad shifts: new child, home purchase or retirement (go-go, slow-go, no-go)
This can be done either by adding a new snapshot or copying the existing snapshot.
-
Click on the menu button in the right hand corner of any existing income snapshot
- Select COPY if you would like to copy all the expense information into your new snapshot. Select ADD if you would like to start a blank snapshow
- Add a descriptive name for your new income snapshot
- Add the start age (for couples this is the primary user)
- Add the end age (for couples this is the primary user)
- Click "Copy" or "Create"
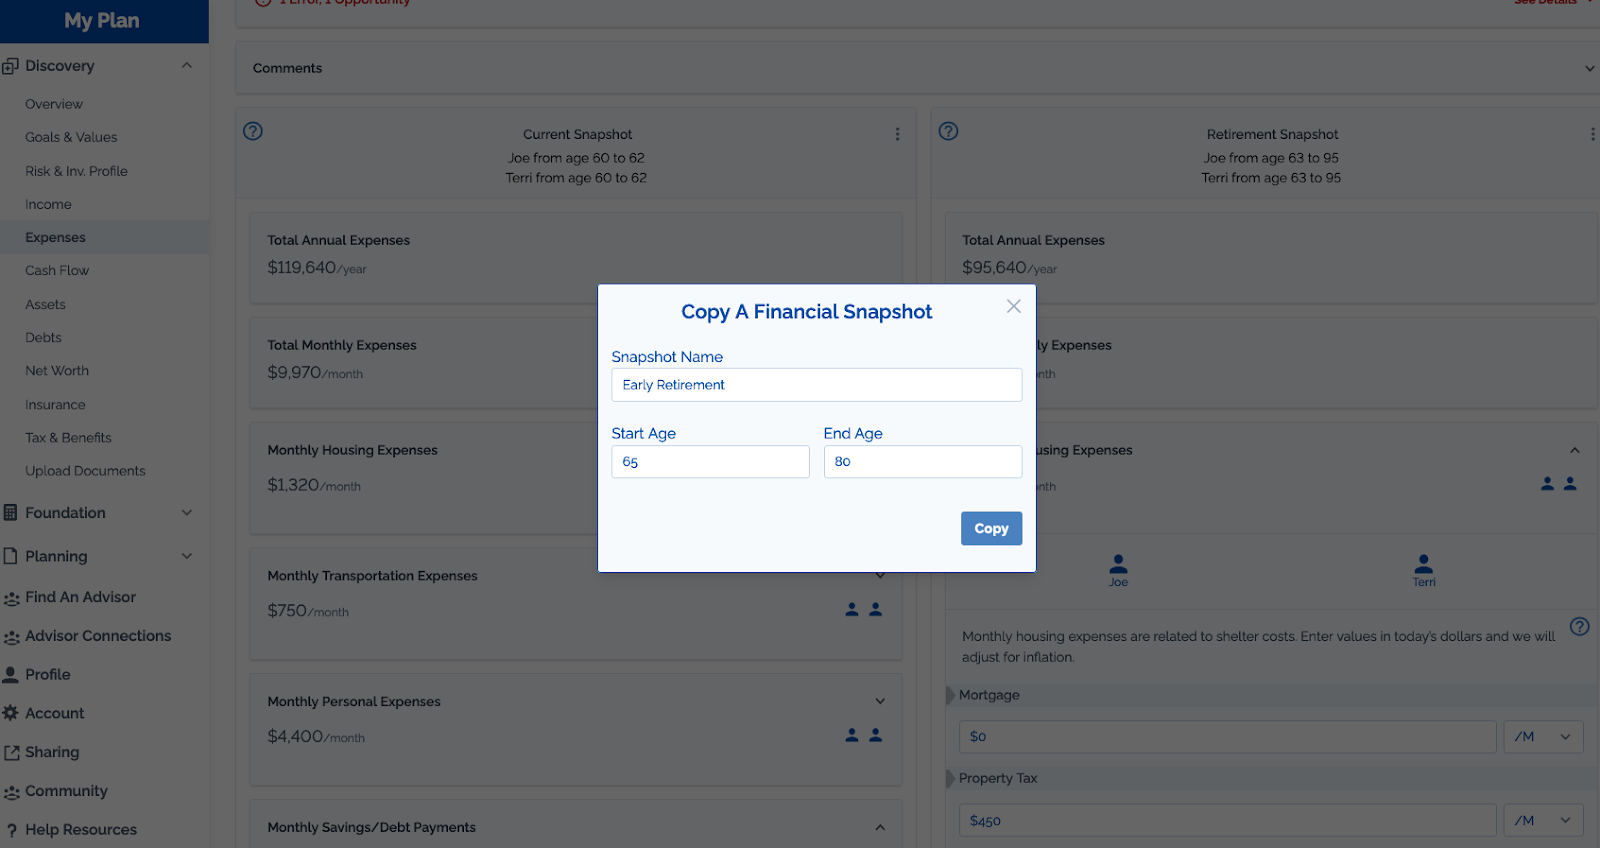
Tip: After adding a new snapshot it may be necessary to change the ages for other snapshots. This will not happen automatically.
🔁 Infrequent Expenses
The Expense Section includes up to three calculators at the end of each snapshot to help determine infrequent expenses.
These are important for cash flow planning but don’t directly show up in the spending total. They’re mainly for reference and budgeting insight.
Examples:
- Vehicle Maintenance: Things like tires, oil changes, unexpected repairs—not necessarily annual
- Vehicle Replacement: They plan to buy a $45,000 vehicle every 10 years, trade in the old one for $10,000. That works out to about $330/month—but we’d add that manually to the Transportation section when the loan ends.
- Home Repairs & Maintenance: For essentials like replacing a roof or appliances. We estimate this based on structure value, not total home value. If they live in a high-cost urban area, much of their value may be land.
🧠 Advisor Tip:
- If future cashflow is a block for clients, ask them to enter current cashflow and then discuss together how that might change in the future
- If detailed expenses are a block or exist in an external spreadsheet, expenses can be added as a lump to misc spending. Make sure to separate out expenses that may change over the life of the plan (mortgage, debt payments, etc)
- For an income/expense entry shortcut, view this resource on creating a quick plan with Adviice
- Saving amounts are not directly used unless Manual mode is activated in Planning Section
💡 Final Note
Always enter expenses in today’s dollars. The platform will apply inflation automatically, so you don’t need to make those adjustments yourself.
🛠️ Troubleshooting:
- Where Do I Add Future Expenses like a New Car or Roof Replacement?
- How To Build a Baseline for Your Retirement Spending
- Getting Rid of Warning W191: Information Missing From Expense Assumptions
- Where Do I Add Cottage/Vacation Property Expenses?
- How Do I Fix Age Gap/Overlap Errors (Error 228,192,522 and 668)
More help articles can be found here.
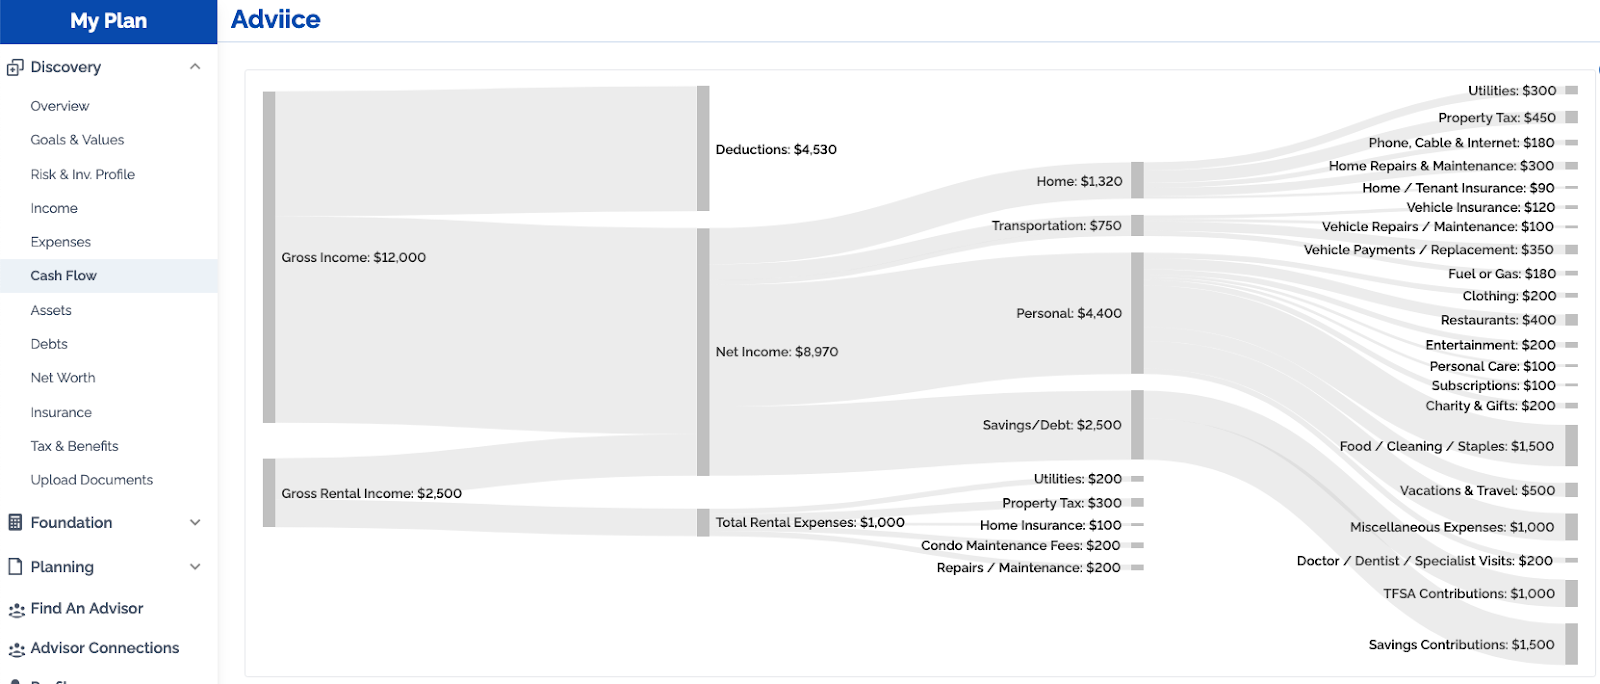
👥 Cash Flow
The Cash Flow section visually represents your client’s current financial situation, providing insight into how their income and expenses are flowing. The platform pulls income data from the Income section and expenses data from the Expenses section to create a clear visual representation. This helps both advisors and clients easily identify discrepancies and understand their cash flow.
👁️Visualizing Current Cash Flow
The Sankey diagram is used to display the cash flow. This diagram gives a visual breakdown, from gross income all the way to net income and the corresponding expenses.
- Gross Income: Represents the total income entering the household.
- Deductions: This includes taxes, pension contributions, and other deductions entered in the Income Section
- Net Income: What remains after all deductions have been made.
- Expenses: A breakdown of current spending, visualized alongside net income.
⚠️ Discrepancies Highlighted by the Platform
Sometimes, discrepancies can arise between the entered income and expenses, which the platform will highlight.
- Missing Gross Income
- Triggered: Either when Gross Income minus Deductions doesn’t equal Net Income or when expenses plus savings exceeds Net Income.
- How to Fix
- Missing Deductions
- Triggered: When Gross Income minus Deductions is greater than Net Income
- How to Fix
- Missing Expenses
- Triggered: When spending plus savings plus debt is greater than Net Income
- How to Fix
- ❗Automatic Assumption❗If missing expenses are identified, the platform assumes they are personal spending and carries that forward into retirement. For example, $2,000 worth of missing expenses will be considered part of future retirement spending.
- Missing Gross Rental Income
- Triggered: Missing gross rental income typically happens when net rental income has been over estimated.
- How to Fix
- Missing Rental Expenses
- Triggered: Missing rental expenses happens when gross rental income minus net rental income is higher than reported rental expenses.
- How to Fix
🧠 Advisor Tip:
- The Cash Flow Section is an excellent way to see gaps in client data
- It is common for clients to be underestimating expenses. Discuss with them whether this missing amount is being saved or spent and add those missing expenses either to the Savings area of the Expense Section or the misc spending area.
- Encourage clients to track expenses and gain more clarity over unknown spending
👥 Assets
The Asset section is where clients capture their financial and real assets, such as savings accounts, investments, homes, and vehicles. It also includes contribution room information, such as for RRSPs, TFSAs, and, if applicable, First Home Savings Accounts.
💰Financial Assets
Here Clients will enter their financial assets, which may include:
- RRSP or RRIF
- TFSA: This is broken down into two types of accounts:
- TFSA Savings: A short-term savings account, often used for emergency funds or saving for a future purchase. These funds will NOT be accessed for retirement decumulation
- TFSA Investment: A longer-term investment account, typically for retirement or estate planning purposes.
- Non-Registered Accounts: These accounts may include taxable investment accounts, and it's important to enter the cost base (original value) for these investments, as this helps calculate capital gains when investments are sold in the future.
- Spousal RRSP: Any Spousal-RRSPs should be listed under the person who will withdraw from the account as a Spousal-RRSP.
- LIRA or LIF: Details on how they are unlocked are controlled in the Advanced Options are of the Projection Section
- FHSA: Both the current balance and the year it is opened (or will be opened) is essential to calculate contribution room
- RESP: If clients have multiple children, enter the full amount of grant received, this can be further detailed per child in the Education Plan Section of the Foundation Phase
- DCPP, Group RRSP, DPSP and ESPP: Balances are entered here while contribution percentages are detailed in the Tax and Benefits Section
If a client has more than one RRSP, TFSA or LIRA encourage them to enter multiple accounts as a single value.
🏠Real Assets
In addition to financial assets, we also need to track real assets, such as:
- Vehicles (cars, boats, etc.)
- Homes (primary residence, vacation properties, etc.)
- Rental Properties: If your client owns any rental properties, this will also be captured here.
🧾Contribution Room
The contribution room helps the platform understand how much can be contributed to registered accounts. Have clients enter values as of January 1st of the current year and then detail if there have been any contributions so far this year.
💡 Final Note
Aim to enter balances as of the beginning of the year when possible. The platform assumes these values are start of year values and applies growth based on this assumption.
🛠️ Troubleshooting:
- What is the difference between TFSA Contributions and TFSA Savings Contributions?
- How Do I Add Joint Accounts?
- Who's Asset is My Spousal RRSP?
- Do I Have to Enter Start-of-the-Year Values for Investment Accounts?
- What to do if Assets tab is missing an account type?
- What Do I Enter for the Non-Registered Adjusted Cost Base (ACB)?
- How to Add Restricted Share Units (RSUs) to My Plan
- Can I Set up Multiple RRSP and LIF/RIF Accounts Under One Person?
More help articles can be found here.
👥 Debts
The Debt section allows your client to enter outstanding debts, such as vehicle loans, credit card balances, mortgages, and any other types of consumer debt. This information is crucial for projecting your client’s future financial situation, as it helps to calculate how these debts will affect their retirement and overall cash flow.
🏦 Adding Debts
In this section, your client will input their debts and the details for each including:
- Name of Debt: What is the debt called (e.g., vehicle loan, credit card)?
- Debt Type: This refers to whether it is a joint debt or individual debt.
- Balance: The outstanding amount on the debt.
- Interest Rate: The rate at which the debt is accumulating interest.
- Payment Frequency: How often payments are made (e.g., monthly, bi-weekly).
If your client has additional debts, they can be added here. You also have the option to delete any debt if it’s no longer relevant.
🏠Real Estate Debt
If your client has a mortgage, you will first need to input it in the profile section. Once that is done, the debt section will automatically include fields to prompt for additional information such as:
- Mortgage Balance
- Interest Rate
- Mortgage Payments
- Renewal Date/Rate: If there is a mortgage renewal coming up you can enter it here. If no value is entered here the platform assumes the same interest rate throughout the life of the mortgage
Note: The interest on rental mortgages is assumed to be tax deductible.
💡 Final Note
The platform uses payment information from this section NOT the expense section when running projections. It is important that these values are correct.
🛠️ Troubleshooting:
More help articles can be found here.
👥 Net Worth
The Net Worth section provides a clear snapshot of your client’s financial situation by summarizing assets and debts. It brings together all the information the client has inputted in the Assets and Debts sections, offering a comprehensive view of your client’s financial health.
📈 Asset Summary
In this section, you’ll see a list of all the assets your client owns, as entered in the Assets section. This includes:
- Financial Assets: RRSP, TFSA, FHSA, non-registered accounts, and locked-in retirement accounts (LIRAs).
- Real Assets: Homes, vacation properties, vehicles, etc.
📉Debt Summary
The Debts section will show the total of all outstanding debts entered previously. This could include:
- Consumer Debt: Vehicle loans, credit card debt, personal loans, etc.
- Real Estate Debt: Mortgages, home equity lines of credit, etc.
The platform will automatically subtract your client’s total debts from their total assets to determine their Net Worth.
🧾TFSA, RRSP, and FHSA Contribution Room
This section also provides a summary of any contribution room for:
- TFSA (Tax-Free Savings Account)
- RRSP (Registered Retirement Savings Plan)
- FHSA (First Home Savings Account)
It’s important to double-check the contribution room, especially if your client has unused space, as this could impact their financial strategy, particularly when planning for retirement or home purchases.
👁️ Reviewing Net Worth
The Net Worth summary offers a good opportunity to double-check the information for completeness. For example, a client might realize they’ve forgotten to include an old locked-in retirement account (LIRA) from a previous employer, which could potentially add value to their assets.
🧠 Advisor Tip:
- Verify all assets and debts to ensure accuracy.
- Update contribution room for any registered accounts (TFSA, RSP, FHSA).
👥 Insurance
The Insurance section allows clients to capture important details about their existing insurance coverage, whether it’s private insurance or employer-sponsored. This includes life insurance, disability insurance, and critical illness insurance.
🛡️Insurance Policy Details
For each type of insurance, be sure to capture the following information:
- Policy Type: Life, critical illness, short-term disability, long-term disability.
- Coverage Amount: Enter the total coverage provided by the policy.
- Policy Start Date and Expiry Date: This is particularly important for employer-sponsored policies, as their coverage may end when your client leaves their employer. Make sure to note the expiry date of the insurance coverage.
📝Double-Check for Employer Insurance
For any employer policies, make sure to confirm the expiry date is set according to when the client plans to leave their employer. This ensures that the insurance plan reflects their expected employment timeline.
🧠 Advisor Tip:
- Life insurance amounts are used in the AI Survivor Scenario strategies. This is why accurate end dates and beneficiaries are essential.
- Disability and Critical Illness amounts are not automatically pulled into projections, but serve as a discussion point.
- If there are no entry fields in this section or a type of insurance is missing, you can add them in the Profile Section.
👥 Tax & Benefits
The Tax and Benefits section focuses on capturing important tax-related information, such as RRSP and TFSA contribution room, pension details, OAS, and CPP benefits. This section also covers any employer benefits, such as defined benefit pensions, group RRSPs, and more.
🧾 RRSP and TFSA Contribution Room
- Registered Retirement Savings Plan: This section allows you to capture your client's RRSP contribution room.
- Tax Free Savings Accounts: The platform also tracks your client’s TFSA contribution room.
- First Home Savings Account: If applicable, the First Home Savings Account contribution room is also included.
💰Employer Benefits
Defined Benefit Pensions:
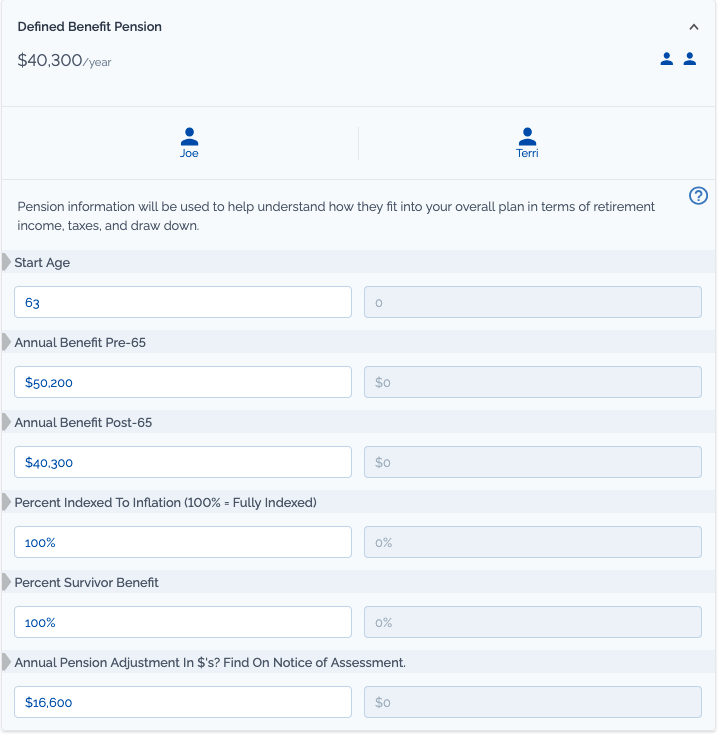
- Capture Pension Details:
- Start Date: When the pension is expected to start.
- Pre-65 and post-65 benefit amounts: May be different if bridge benefit is present
- Inflation Indexing: This determines how the pension adjusts for inflation. Enter 0%, 50%, or 100% depending on your client's pension plan.
- Survivor Benefits: Specify the percentage of survivor benefits
- Pension Adjustment: This is crucial because contributions to a defined benefit pension reduce RRSP contribution room. Make sure to capture the pension adjustment from your client’s Notice of Assessment.
Defined Contribution Pensions/Group RRSP/DPSP/ESPP:
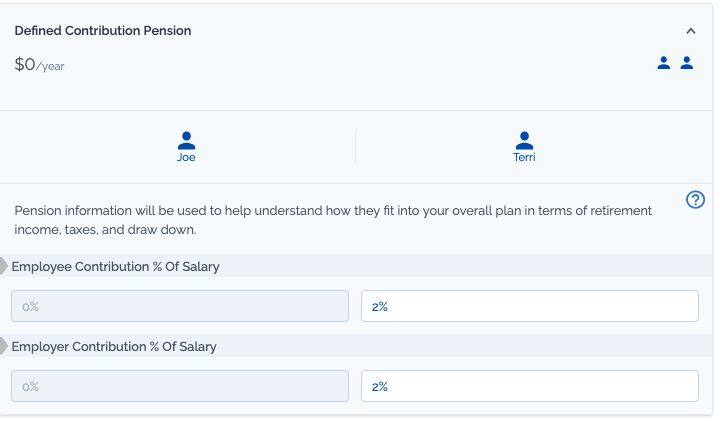
- Enter employee and employer contribution percentages
- If there is not an option to enter these plans, you may have to activate them in the Profile Section.
🖋️ Wills and Power of Attorney
- Wills: Record whether your client has a will in place and when it was last updated.
- Power of Attorney: Include details about whether a Power of Attorney has been set up.
🧓 Trusted Contact Person
In accordance with the June 2024 FP Canada rule, your clients are able to designate a Trusted Contact Person.
This designation includes name, relationship and contact information.
🏛️ Old Age Security (OAS)
- OAS Eligibility: Record how long your client has lived in Canada between ages 18-65. This will be used to calculate OAS benefits.
- Partial OAS: The platform will calculate partial OAS for clients that have not been in Canada for the full 40 years.
🏛️ Canada Pension Plan (CPP)
- CPP Contributions: Ensure your client's Statement of Contributions is captured to accurately calculate their future CPP benefits.
- Past and Future Years: The platform creates a CPP estimate based on both past contributions and future income assumptions. This means their estimate will change depending on their planned income/retirement date.
🛠️ Troubleshooting:
- Can I Input CPP Estimates Instead of the Year-By-Year CRA Data?
- Where Do I Enter CPP/OAS Income If the Client is Already Receiving Benefits?
- How Do I Add Multiple Pensions To a Plan?
- How Do I Add Employer Contributions to a Group RRSP?
- How Would You Capture Employee/Employer Matching Contributions to an RRSP?
- Why Are CPP Estimates Lower for Partner?
- Why Am I Unable to Enter Numbers in the CPP Benefits Estimate?
More help articles can be found here.
👥 Upload Documents
The Document Upload section is the final part of the Discovery Phase. This section is crucial for clients working with a financial planner to ensure all the information provided in the discovery phase is accurate and aligned with supporting documents. The documents will be securely uploaded and encrypted.
🔒Secure Document Upload
- Encryption & Security: All documents uploaded are SEC-secured and encrypted in Canada to protect personal information.
- Privacy: Clients can crop out sensitive information, such as:
- Account numbers
- SIN numbers
- Addresses
- All that’s needed is the first name on account statements to identify the account holder and the type of account.
🗂️Uploading Multiple Documents
- Clients can upload multiple documents under one icon. This allows flexibility if a single file contains multiple items that need to be referenced.
- If a document doesn’t fit under any predefined categories (e.g., group RRSP), clients can upload it under a miscellaneous category.
🧑💼Document Verification
- Advisors will cross-reference the documents uploaded by clients with the information provided in the discovery phase to ensure everything matches and is correctly categorized.
- Proper verification will ensure that future financial plans are based on accurate and comprehensive data.
🛟 Emergency Fund
The Emergency Fund section doesn’t directly affect projections or other areas of the plan. However, it plays a valuable role in supporting client decision-making by helping them understand how much cash they should ideally have on hand as a financial buffer.
💬 What the Client Enters:
The client will answer a short series of yes/no questions related to:
- Existing debt levels
- Home ownership status
- Whether they have dependants
- Ownership of a rental property
- Exposure to variable or self-employed income
📊 What the Platform Calculates:
Based on the answers provided and the client’s current or projected monthly expenses, the platform recommends an emergency fund target. This is typically expressed in months of essential spending — for example, 3–6 months of core retirement expenses.
🧠 Advisor Tip:
- Use your judgment to adjust or reinforce the recommended buffer depending on the client’s risk tolerance and income predictability.
- For clients in retirement: A 3–6 month reserve is usually sufficient, but you may recommend more in early retirement years when market timing risk is highest.
🛠️ Troubleshooting:
More help articles can be found here.
🏠 Buying a Home
The Buying a House section is designed to highlight any future primary residence purchases, whether it's a new purchase, an upgrade, or a downsizing scenario.
This section helps model:
- Required cash flows for a home purchase
- Timing of purchase
- Down payment and closing costs
- Potential mortgage needs
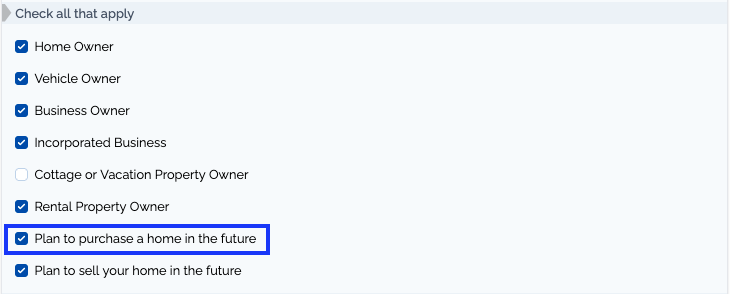
This section will be activated if the client indicates in their onboarding questions an intent to purchase a home in the future. If you would like to activate it manually you can do so in the Profile Section by clicking “Plan to purchase a home in the future”
🧾 What the Client Enters:
This Section is split into three columns:
- Maximum Affordability: This is optional for projections but serves as a valuable conversation tool. Clients enter:
- Gross household income at the time of purchase
- Estimated Monthly Expenses at the time of purchase
- Estimated Mortgage Rate
- Down Payment Goal: This is needed for platform calculations. Clients enter:
- Target purchase price of the new property
- Down payment goal (in dollars or as a % of the purchase price)
- Estimated closing costs (for legal fees, land transfer tax, moving costs, etc.)
- Timing of the purchase (month and year)
- Estimated Mortgage Rate
- Mortgage Insurance Estimate: This is calculated based entered numbers and serves as a conversation tool.
🧮 How the Platform Calculates:
- Total purchase requirement = Down Payment + Closing Costs
- If the client does not have 100% of this amount, the platform will automatically calculate the required mortgage.
- The platform does not currently perform mortgage qualification stress testing, so use the gross income field to assess affordability contextually.
🧠 Advisor Tip:
- Only one purchase can be modelled using this section. If you would like to model multiple housing scenarios (a purchase and a downsize) you will need to do the second one in the Projections Section.
- Confirm that closing costs are reasonable (usually between 1.5%–4% of the purchase price).
📍 Reminder:
This section only models the purchase side of the home transaction. If the client is selling a current home to fund the new purchase, make sure the sale is recorded in the Selling a House section of the plan with correct timing.
🛠️ Troubleshooting:
- How do I Model a Downsize in Retirement
- Selling & Downsizing Real Estate in Retirement - April 2025 Case Study
More help articles can be found here.
🏠 Selling a Home
The Selling a House section is used to model a future home sale, typically to support a downsize, move, or liquidity event in retirement.
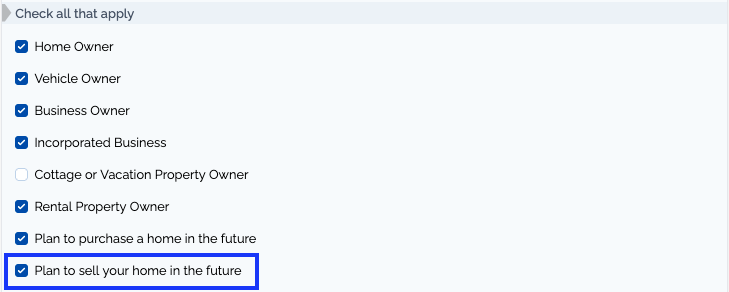
This section will be activated if the client indicates in their onboarding questions an intent to purchase a home in the future. If you would like to activate it manually you can do so in the Profile Section by clicking “Plan to purchase a home in the future”
🧾 What the Client Enters:
- Estimated sale price: This amount should match the value of the property listed in the Assets section.
- Estimated selling costs: Entered as a percentage of the sale price (e.g., realtor commissions, legal fees, staging, moving costs). A typical estimate might range from 4% to 6%.
- Sale date: Month and year when the sale is expected to occur. This is often timed alongside a new home purchase.
🧮 How the Platform Calculates:
- Net sale proceeds = Sale Price – Selling Costs (% of sale price)
- Proceeds will be available in the year of sale to support cash flow or a new property purchase.
- If there's a mortgage balance, this must be reflected in the Debt section of the plan and will reduce the final proceeds.
🧠 Advisor Tip:
- Confirm the sale price aligns with the market value listed under the client's real estate holdings.
- Ensure the estimated costs are within reason based on the property type and location.
- Selling a home does not automatically pay off the mortgage. If there is an existing mortgage on the property this must be paid off manually in either the Debt Payoff Section or the Projections Section.
📍 Reminder:
Home sale proceeds only appear in projections if:
- A sale is recorded here and
- The property is listed in Real Assets with matching value and ownership
Always double-check both sections to ensure accurate projections.
🛠️ Troubleshooting:
- How do I Model a Downsize in Retirement
- Why Do the Proceeds From Selling a Home Show Up as an Expense in Projections?
- How to Model Two Home Sales in Your Plan?
- What is the "Estimated Sale Price" Field Used for in Selling a House Section?
More help articles can be found here.
💳 Debt Payoff Plan
The Debt Payoff Plan section offers a visual forecast of how personal debts are expected to be paid down over time. This view helps both clients and advisors understand the repayment timeline, identify opportunities for acceleration, and assess the impact of interest rates on the overall plan.
Debt information is pulled directly from the Debts Section of the Discovery Phase.
💬 What the Client Enters:
Clients input:
- Optional: Extra monthly Payment Goals
- Optional: Extra lump sum payments
- Optional: Extra Payment Threshold
📊 What the Platform Does:
- Displays debt payoff on both monthly and annual timelines
- Shows when each debt is projected to be fully repaid
- Allows users to simulate extra payments and observe their effect
- Applies extra payments only to debts with interest rates above the client's set threshold (e.g., 8%)
Note: Extra payments entered here or prompted by setting a threshold will pull into all projections.
🧠 Advisor Tip:
- Use the Interest Rate Threshold to simulate debt repayment using surplus: Extra monthly payments will only be applied to debts with an interest rate above this threshold. This avoids allocating funds toward low-interest or zero-interest debts unnecessarily.
- Use Extra Monthly Payments to simulate accelerated debt repayment
- Enter Lump Sum Payments in exact months: Ideal for clients receiving bonuses, inheritances, or other one-time windfalls. These can be added to a specific debt in a specific month.
🛠️ Troubleshooting:
- Adding Extra Lump Sum Debt Payments
- Adding Specific Lump Sum Debt Payments
- Adding Extra Monthly Debt Payments
- How to Pay Off Debt With a Lump Sum?
More help articles can be found here.
📈 Investment Plan
The Investment Plan section sets the long-term return expectations for the plan, based on the client’s asset allocation, investment fees, and account types. This section plays a crucial role in projecting portfolio growth, estimating sustainable withdrawals, and aligning investment strategy with retirement goals.
💬 What the Client Enters:
Clients are asked to input:
- Expected investment fees (MER) for overall portfolio
- Asset allocation: percentage in equities (stocks), fixed income (bonds), and cash
- Cash and GIC return assumptions
- Savings account return assumptions
- Optional: Whether rebalancing is automatic or manual (this does not affect projections)
📊 What the Platform Does:
- Uses FP Canada’s long-term return assumptions as the baseline
- Reduces expected returns by the MER to reflect net returns
- Applies asset allocation and return assumptions across taxable, registered, and corporate accounts
- Forecasts investment growth over time
- Factors in cash and short-term asset returns separately (e.g., for emergency funds)
🧠 Advisor Tip:
- Ensure that all Stock/Bond/Cash Assumptions are complete and an average investment return has been generated. Leaving out one of these fields will keep a return from being calculated and affect projections.
🛠️ Troubleshooting:
- How Do I Change Rate of Return Assumptions?
- How Do I Adjust Asset Allocation?
- How Do I Change the Geographical Diversification Values on the Investment Plan?
- Why Am I Receiving an 'Allocation Error in Table" Warning?
- What Are the Effects of Investment Plan Rebalancing on the Projections?
- How to Fix Error with Asset Allocation Not Equalling 100%
- How Do I Include GICs in My Investment Plan?
More help articles can be found here.
🎓 Education Plan
The Education Plan section helps families map out future RESP contributions and optimize the Canada Education Savings Grant (CESG). It’s designed to automatically build a smart contribution strategy that takes full advantage of available grants and optional catch-up contributions.
💬 What the Client Enters:
Clients answer a few key questions:
- Do you want to maximize the annual CESG grant?
- Do you want to catch up on missed CESG grants?
- How much has already been contributed in the past?
- How much grant (CESG) has already been received?
- Optional: Customize asset allocation, contribution amount, and withdrawal timing.
📊 What the Platform Does:
- Calculates the annual RESP contribution required to maximize:
- The $500 annual CESG (based on a $2,500 contribution)
- Catch-up CESG from missed years (additional $2,500 = $500 extra grant)
- Models RESP growth using investment returns based on the child’s age and asset mix
- Projects post-secondary withdrawals beginning at age 18 for 4 years (default)
- Ensures RESP contributions and grants stay within the lifetime limits:
- $50,000 lifetime contribution limit per child
- $7,200 lifetime CESG limit per child
📌 Key Concepts for Education Planning:
| CESG Grant | 20% of annual contributions, up to $500/year |
| Max Grant Strategy | $2,500/year = $500/year grant |
| Catch-Up Strategy | Extra $2,500/year = extra $500 grant (max $1,000/year) |
| Lifetime Max Grant | $7,200 per child (hit by age 14.5 if maxed annually) |
| Lifetime Max Contribution | $50,000 per child |
🧠 Advisor Tip:
- Contributions outlined in this Section automatically flow through to the projections. They are in the expenses area of the chart.
- Use the Advanced Options to input accurate data for past contributions and grants if available
- Encourage clients to call CESG for an up to date contribution/grant amount
- For new Canadians, make sure catch-up is turned off if the child was not eligible during years spent outside Canada
- Guide clients on whether to add RESP contributions beyond the $36,000 needed to max out grants — especially if their TFSA and RRSP room is already used up
- Advise clients to shift asset allocation over the lifetime of their RESP
🛠️ Troubleshooting:
- Adding An RESP Asset Allocation Override
- Adding An RESP Contribution Override
- Adding An RESP Withdrawal Override
More help articles can be found here.
📊 Future Cash Flow Assumptions
This section helps you fine-tune the timing and amount of future income and expenses across your client’s lifetime.
The platform pulls initial values from the Discovery section and builds a year-by-year timeline using future assumptions like retirement, downsizing, part-time work, and government benefits.
🧾 What’s Automatically Included
- Employment/Rental Income from the Discovery phase
- Pensions, CPP, and OAS based on client input and age
- Current Spending from the Discovery section
- Future Events entered through Buying/Selling a home, Debt payoff plan, or Education Plan
🚫What isn’t Included
- Investment draws: these will be added in the Projections section
- Tax: this will be calculated and added in the Projections section
- Automatically Calculated Government Benefits: his will be calculated and added in the Projections section
✏️ Adjusting Assumptions
You can override any future income or expense value directly in this section.
For example:
- If a client expects $30,000 in part-time income in the first year of retirement instead of $20,000, simply enter that amount for that specific year.
- If clients plan a one-time large travel expense (e.g. $10,000 extra), you can add it just for that year.
💡 These overrides are locked in and won’t update if you later change the Discovery section, so use them sparingly for specific known changes.
✅ Advisor Tips
- Plan in today’s dollars for expenses, future dollars for income
- Use overrides selectively — Discovery should still hold the bulk of inputs
- Recalculate often after making changes to see updated projections
🛠️ Troubleshooting:
- Why Don't Investment Draws Show Up in Future Cashflow?
- Why Are Mortgage/Debt Payments Not Included in Housing Expenses?
- How do You Enter Income/Expenses that Occur Late in the Year?
- Do CPP Projections Take Future Earnings into Account?
- Why Does My Expense Total in Discovery Not Match My Expenses in Future Cash Flow?
More help articles can be found here.
🇨🇦 CPP & OAS Estimate
This section provides an estimate of future Old Age Security (OAS) and Canada Pension Plan (CPP) benefits based on:
- Inputs from the Tax & Benefits section in Discovery
- Assumptions in the Future Cash Flow section (e.g. employment income)
These are estimates only and do not include the Child Rearing Drop-Out provision for CPP.
🧓 Old Age Security (OAS)
OAS is not based on income or contributions — it’s based on residency in Canada between ages 18 and 65.
Start Age:
- OAS starts at age 65 (by default)
- Can be delayed for a higher benefit (up to age 70)
Delaying OAS:
- Increases the benefit by 0.6% per month delayed (7.2% per year)
- Could make sense for clients with good longevity or higher assets
- May not be optimal for those with low income or poor health
💼 Canada Pension Plan (CPP)
CPP is based on contributions during working years:
- Each year with contributions toward CPP creates a partial or full credit
- Estimate is based on:
- Past income (from Discovery)
- Future earnings (from Future Cash Flow)
Start Age:
- Earliest start: Age 60
- Latest start: Age 70
- Monthly benefit increases if delayed (by 0.7% per month = 8.4% per year)
Delaying CPP:
- Higher annual benefit
- Indexed to inflation
- Good for longevity protection
- May require more withdrawals from investments in your 60s
⚙️ Setting Start Ages
To set the CPP and OAS start age:
- You can choose a specific Start Age in the plan
- This automatically updates Future Cash Flow and Projections Section
- Start Ages can be set differently for different scenarios by using the Scenario Selection dropdown and the top of the page
- Or, use the AI Strategy Tool in the Projections section to help determine optimal timing
✅ Advisor Tips
- Use this section to educate clients about the tradeoffs of early vs. delayed benefits
🛠️ Troubleshooting:
- Why Does my Service Canada CPP Estimate Not Match the Platform Estimate?
- Does the CPP Calculation Include Child Rearing Drop Out (CRDO) Years
- Do CPP Projections Take Future Earnings into Account?
- How is OAS Indexing Applied on Adviice?
- How Are Future CPP, OAS, TFSA/RRSP Contribution Room and Tax Rates Indexed?
- Are CPP/OAS Estimates in Today's Dollars?
- I am Already Receiving CPP/OAS, Why is the Estimate Page Showing Zero?
- Why Do CPP Estimates Not Change After I Enter This Year's Max Pensionable Earnings?
More help articles can be found here.
🧾 Tax & Benefits
This section visualizes how tax rates and government benefit clawbacks interact to affect a client’s effective marginal tax rate (EMTR) — a critical concept for optimizing RRSP, TFSA, and income planning decisions.
📈 Marginal Tax Rates
The marginal tax rate is the rate paid on the next dollar of income.
- The chart shows provincial and federal tax brackets as income increases.
- For example, a client in Ontario earning $250,000 will see any additional income taxed at 53.53%.
This is helpful for identifying:
- RRSP deduction value
- When income crosses into higher brackets
🏛️ Benefit Clawback Rates
In addition to taxes, many clients face income-tested benefit clawbacks, such as:
- Canada Workers Benefit
- GST/HST Credit
- Guaranteed Income Supplement (GIS)
- Old Age Security (OAS)
These clawbacks reduce benefits as income increases and act like additional taxes:
- Some benefits have negative clawbacks (like the CWB), where benefits increase with income.
- Others phase out benefits at rates of 50–75%, especially GIS and OAS.
The platform accounts for these clawbacks and integrates them into the EMTR.
📊 Effective Marginal Tax Rate (EMTR)
The EMTR combines both income taxes and benefit clawbacks into a single rate.
This is where surprises often appear:
- A client might have a higher EMTR at $30,000 income than at $47,000, due to benefit phase-outs.
- This is critical when planning withdrawals, RRSP contributions, or pension income.
The EMTR graph helps you:
- Avoid costly thresholds (e.g. OAS clawbacks above ~$91,000 in today's dollars)
- Plan RRSP vs TFSA strategies based on current and future EMTRs
🔮 Looking Ahead — Planning for Retirement
You can project EMTRs into the future (e.g. 2045), where:
- GIS clawbacks might apply (up to 75%)
- OAS clawbacks start around ~$91,000 in income
These rates are shown after-tax, so OAS clawbacks are adjusted for the fact that OAS is taxable.
✅ Advisor Tips
- Use this section to:
- Explain why RRSP withdrawals or income shifts might result in unexpectedly high “tax-like” outcomes.
- Illustrate GIS clawback zones for low-income retirees.
- Illustrate clawback thresholds for higher-income clients.
🛠️ Troubleshooting:
- Tax and Benefits Analysis: Example For Retirees Under Age 65
- Tax and Benefits Analysis: Example For Retirees Over Age 65
- Tax and Benefits Analysis: Example For A Young Family
- How Does the Tax & Benefit Anaylsis Section Work?
- What Do the Government Benefit Acronyms Stand For?
More help articles can be found here.
🛡️ Insurance Needs Analysis
This section provides a basic analysis of insurance needs to identify potential coverage gaps. It’s for educational purposes only — clients should always consult with a licensed insurance advisor before making final decisions.
💀 Life Insurance Needs Analysis
Purpose: Life insurance provides financial protection for dependants in case of unexpected death. The goal is to replace after-tax income and cover any lump-sum financial obligations.
Key Inputs:
- Existing Coverage: Sum of all life insurance (term + permanent)
- Dependants: Anyone relying on your income (children, spouse, parents)
- Monthly After-Tax Income: Net income needed for dependants
- Years to Retirement: Number of years coverage is required
- Discount Rate: Used to calculate present value of future income (default: 4%)
- Other Needs: Debt, final expenses, child’s education, taxes, etc.
Calculation: The platform calculates the present value of future income needs plus any lump-sum needs. This is compared to existing insurance to reveal a coverage gap (if any).
Notes:
- If the answer to the Dependants question is ‘No’ the analysis will assume no life insurance is needed
- Ensure life insurance details are entered in the Insurance section of Discovery. AI strategies use this data in survivor scenarios and not the data from the Insurance analysis.
🏥 Critical Illness Insurance Needs
Purpose: Provides a lump-sum benefit if diagnosed with a serious illness (usually one of 25–26 covered conditions). Helps offset temporary income loss or extra medical expenses.
Key Inputs:
- Existing Coverage: Total private and employer coverage
- Monthly After-Tax Income: Net income required during illness
- Months of Income Required: Number of months of income replacement
- Additional Costs: Estimate medical, home care, or child care costs
Calculation: Determines total critical illness insurance need by multiplying income by months required + any additional costs.
Note: This information is not used in the platform projections
♿ Long-Term Disability Needs
Purpose: Replaces income if a client becomes disabled and cannot work long term. Disability is more common than death before retirement — 6% of Canadians between 35–65 experience it.
Key Inputs:
- Existing Coverage: All current LTD benefits from private or employer sources
- Monthly After-Tax Income: Net income that needs replacing
- Other Monthly Needs: Additional support needs not captured in basic expenses
Calculation: Helps estimate whether current disability insurance is sufficient to meet lifestyle and care needs during a long-term disability event.
Note: This information is not used in the platform projections
🧠 Advisor Tip:
- Use this tool to identify potential gaps that may require a referral to an insurance professional
- Revisit this section during major life events: having a child, buying a home, retiring, etc.
- Ensure the Insurance section in Discovery is complete, this is the section that is used for projections and AI strategies and not the Insurance Anaylsis.
📄 Foundation Report Overview
The Foundation Report is one of two main types of reports you can create on the Adviice platform (the other being the Planning Report). It’s designed to summarize and present key financial data collected during the Discovery and Foundation phases.
🧰 How to Create a Foundation Report
- Access the Foundation Report Builder
- Navigate to the Foundation section of the client’s portal.
- Click to start a new report.
- Use Presets
- Type / to open a list of preset sections.
- These presets are configured at the company level.
- If you have admin access, you can customize, add, or edit these presets in your Planner Portal settings.
- Choose to:
- Import the entire Foundation set.
- Or select individual sections (e.g., Net Worth, Insurance, Income).
- Customize the Content
- Add your own text and sections using the rich text editor.
- Style your content with:
- Headings (H1, H2, H3)
- Bold, Italic, and Color
- Alignment & Justification
- Add images (e.g., screenshots, off-platform charts).
- Insert tables:
- Add or remove columns and rows
- Resize or merge cells for layout flexibility
- Add page breaks for a clean layout when printing or generating PDFs.
- Insert Platform Charts
- Pull in visual charts from:
- Discovery
- Foundation
- Pull in visual charts from:
📤 Finalizing & Sharing
- Once your report is built:
- Click Save Changes
- Click View to preview how the client will see the report
- Click Publish when you're ready to make it client-visible
- After publishing:
- Choose whether to send the client a custom email notification (configurable in the Planner Portal).
- The email will:
- Notify the client a new Foundation Report is available
- Prompt them to log into their portal
- Optionally suggest booking a Foundation meeting
📂 Managing Multiple Reports
- You can create multiple reports for the same client (e.g., one for pre-meeting discovery and another post-meeting summary).
- Each report is saved and can be toggled or reviewed independently within the Foundation section.
✅ Advisor Tips
- Use the Foundation Report to summarize current financial position, not make recommendations (those go in the Planning Report).
- Customize sections to reflect your own planning process or compliance requirements.
- Include visuals and charts for maximum clarity and client engagement.
- Leverage the Foundation Report as a client deliverable ahead of or after discovery meetings.
🛠️ Troubleshooting:
- How to Create a Report
- Creating Custom Report Presets
- Why Are the Charts Cut Off When Trying to Print Reports?
- How to Customize Reports Using Shortcodes
More help articles can be found here.
📈 Final Plan Projections
This section combines all inputs from Discovery and Foundation to create a detailed, year-by-year financial plan customized to your client’s situation.
The platform automatically calculates income tax, government benefits, debt payments, savings, and investment contributions — giving a complete annual snapshot of the client’s financial plan.
📊 What’s Included in Final Plan Projections
- Yearly calculation of surplus or shortfall (income minus taxes, contributions, expenses, debts)
- Automatic investment contributions for surplus years
- Automatic investment withdrawals for shortfall years
- Overrides allowed on any blue-highlighted values for custom adjustments
- Intelligent adjustment of overrides based on account rules (e.g. TFSA/RRSP contribution room, RRIF/LIF minimum withdrawals)
- Debt payments based on minimums from Discovery plus any extra payments from the Debt Payoff Plan
- Automatic extra debt payments when extra cash flow is available and interest rate thresholds are exceeded
📊 Visual Charts Overview
Charts at the top of the page visualize your client’s plan progress:
- Spending Chart: Shows outgoing cashflow including spending, debt payments, and savings contributions. Surplus or shortfall here signals areas to review.
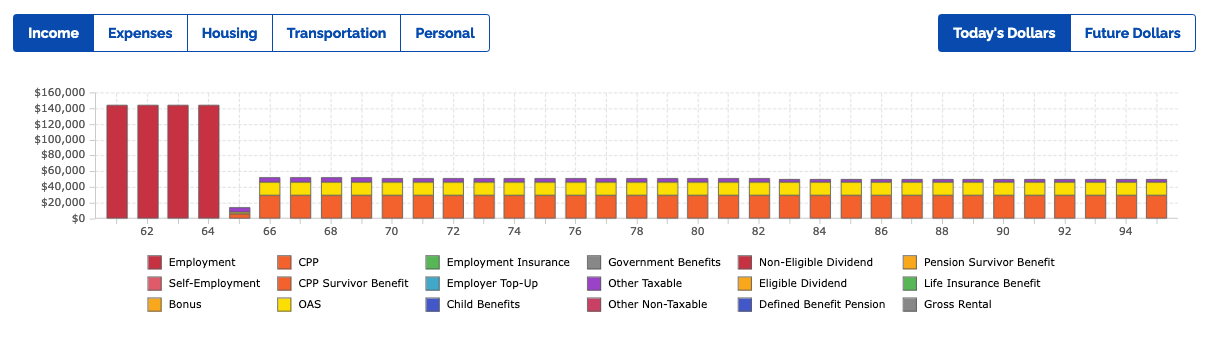
- Income Chart: Shows incoming cashflow including earned income, CPP, OAS, pensions, and benefits.
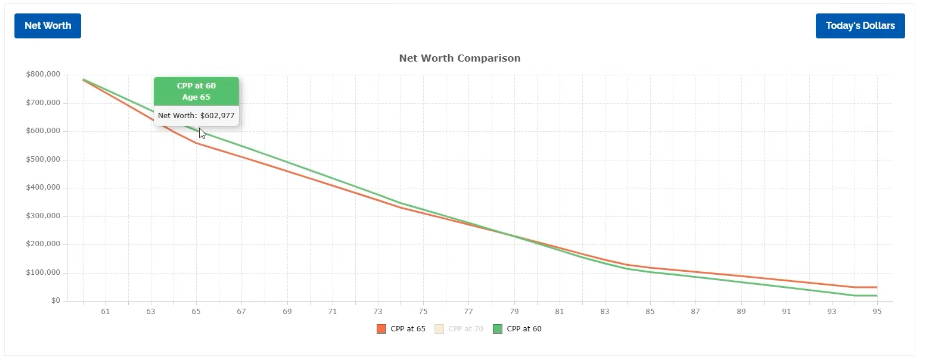
- Net Worth Chart: Includes financial assets (TFSAs, RRSPs, etc) and real assets (homes, cottages), minus debts, projected year-by-year.
- Success Rate Chart: Displays potential retirement outcomes based on historical investment returns and inflation.
💡 Understanding the Success Rate Chart
- Reflects plan variability under different historical market conditions
- Highlights importance of spending flexibility during retirement
📋 Lifetime Totals Summary
Key plan metrics include:
- Plan Funded Amount: Are income and assets sufficient for lifetime goals?
- Success Rate: Probability your client won’t outlive their money despite market fluctuations
- Lifetime Spending: Total expected spending, shown in today’s dollars (inflation-adjusted)
- Lifetime Investment Fees: Total fees based on asset mix and fee structure
- Lifetime Taxes: Total taxes expected, including income and estate taxes
- After-Tax Estate Value: Projected estate value after taxes at plan end
- Lifetime CPP, OAS, GIS Benefits: Total government benefits expected during lifetime
🤖 AI Strategies for Optimization
You can use AI strategies to test different “what-if” scenarios and optimize the plan:
-
Sort strategies by lifetime spending, estate value, lifetime tax or success rate
Enable strategies one at a time and recalculate to see effects
Main AI Strategies include:
- Accumulation/Decumulation: Adjust order of account contributions and withdrawals
- Increase/Reduce Retirement Spending: See how changing spending in retirement will affect the plan
- CPP Start Age: Choose when CPP benefits begin
- OAS Start Age: Choose when OAS benefits begin
- Maximize TFSA: Optimize TFSA withdrawals
- Modify Retirement Spending: See effects of changing spending levels
- RRIF/LIF Conversion Time: Control timing of RRSP to RRIF/LIF conversion and withdrawals
- RRSP Meltdown: Targeted RRSP drawdown strategy
- Survivor Scenario: Adjust for shorter life expectancy
⚙️ Advanced Options for Customization
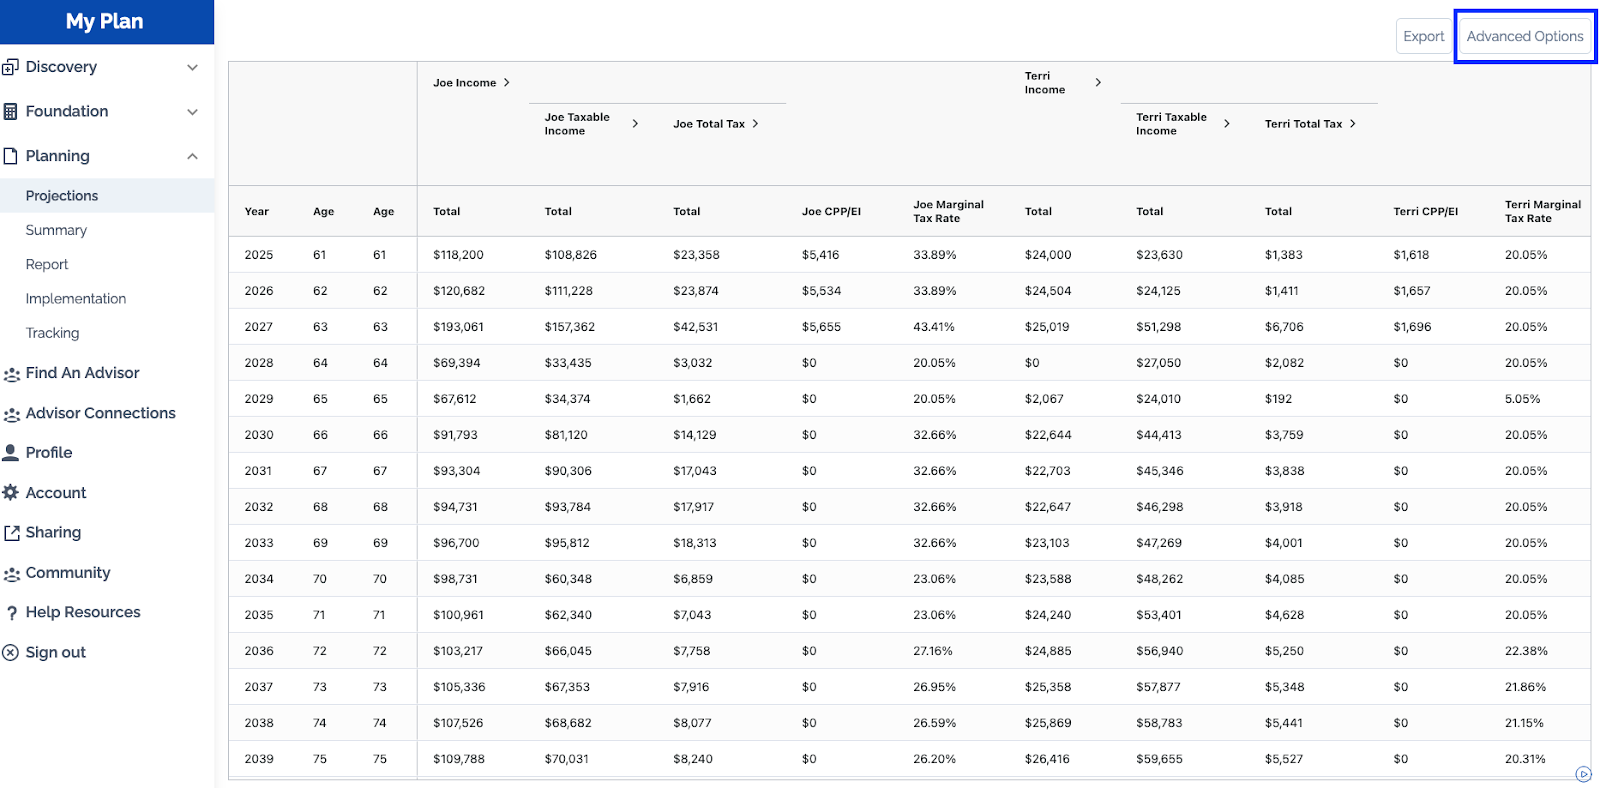
Advanced Options let you fine-tune:
- Starting balances and assumed rates of return by account
- Income type breakdown for non-registered accounts affecting tax calculations (capital gains, dividends, interest)
- Assumptions for home, vacation, and rental properties
- Past tax income (line 23600) affecting future government benefits
- Interest rate threshold for automated debt payoff
💡 Best practice: Make most changes in Discovery or Foundation to ensure smooth data flow into Final Plan Projections.
🛠️ Troubleshooting:
An overview of help articles that address common questions and scenarios. A complete set of searchable help articles can be found here.
Projections:
- How to Add An Override To Investment Return, Asset Allocation, Investment Fees In Final Plan Projections
- How to Add An Override To Investment or Savings Account Contributions or Withdrawals In Final Plan Projections
- How to Add An Override To Income And Expenses In Final Plan Projections
- How Do I Make a Different Scenario?
- How Do I Model Earlier Retirement Dates?
- Why Do I Have a Balance in the Cash Account Column (Surplus/Shortfall)?
AI Strategies:
- How Does the RRSP Meltdown AI Strategy Work?
- How Does the TFSA Maximization AI Strategy Work?
- How Do the Accumulation/Decumulation AI Strategies Work?
- How Does the RRSP/RRIF Conversion AI Strategy Work?
- How Do I Turn AI Strategies Off?
- How Does the Survivor Scenario AI Strategy Work?
Savings/Investments:
- Does the Platform Assume Investment Contributions are at the Start or End of the Year?
- Why Do I See a Non-Registered Surplus in my Plan?
- What Is The Difference Between Automatic and Manual Saving Modes?
Success Rate:
- What Does the Success Rate Percentage Mean?
- How is Success Rate Different Than a Monte Carlo Anaylsis?
Tax:
- Why Don't I See an OAS Clawback Column on my Projection Charts?
- Does the Platform Include Tax Credit Calculations?
🛠️ Case Studies and Trainings:
Every month Adviice holds two webinars to show the platform in use. You can see recordings of the most recent case studies and trainings here.
Planning Examples:
Training Sessions:
Case Studies:
- How to Draw Down Corporate Assets in Retirement
- Selling/Downsizing Real Estate To Help Fund Retirement
- How to Fund Your Retirement
- How to Minimize Tax in Retirement
🔄 Summary
This section provides a condensed roadmap that can be easier to absorb than the projection table in the Planning section.
🔄 How It Works
- Scenarios can be selected using the dropdown menu
- Clients can export this chart using the ‘Export’ button
- Values are in future $s
✅ Advisor Tips
- Balances in the summary are always the end of year value
- Use Summary tables to create detailed contributions/withdrawal plans for your clients to follow
🛠️ Troubleshooting:
- Are Investment Balances in the Summary End of Year Values?
- Why is There a Difference Between Financial Assets in Projections and Summary Views
More help articles can be found here.
🔄 Compare
This section helps you analyze and compare multiple financial plan scenarios to understand how different assumptions affect your client’s outcomes.
📊 What You Can Compare
- Lifetime amounts — total spending, taxes, or estate values over the client’s lifetime
- Net Worth over time — how assets grow or shrink year by year under different scenarios
- Spending guard rails — upper and lower limits to help control withdrawals and account balances
🔍 Examples Scenario Comparisons
- Visualize how different asset allocation/fees impact net worth compounding over time
- Use upper and lower spending guard rails to track how accounts trend toward zero across retirement
- Explore CPP break-even points to see the financial impact of starting CPP at different ages
💡 Tips for Scenario Analysis
- Recalculate scenarios regularly for the most accurate comparisons
📄 Planning Report
The Planning Report is one of two main types of reports you can create on the Adviice platform (the other being the Foundation Report). It’s designed to present your recommendations to your clients.
🧰 How to Create a Planning Report
- Access the Plan Report Builder
- Navigate to the Planning > Report section of the client’s portal.
- Click to start a new report.
- Use Presets
- Type / to open a list of preset sections.
- These presets are configured at the company level.
- If you have admin access, you can customize, add, or edit these presets in your Planner Portal settings.
- Choose to:
- Import the entire Planning set.
- Or select individual sections (e.g., Tax & Benefits, Expenses, Scenarios).
- Customize the Content
- Add your own text and sections using the rich text editor.
- Style your content with:
- Headings (H1, H2, H3)
- Bold, Italic, and Color
- Alignment & Justification
- Add images (e.g., screenshots, off-platform charts).
- Insert tables:
- Add or remove columns and rows
- Resize or merge cells for layout flexibility
- Add page breaks for a clean layout when printing or generating PDFs.
- Insert Platform Charts
- Pull in visual charts from:
- Discovery
- Foundation.
- Scenarios
- Pull in visual charts from:
📤 Finalizing & Sharing
- Once your report is built:
- Click Save Changes
- Click View to preview how the client will see the report
- Click Publish when you're ready to make it client-visible
- After publishing:
- Choose whether to send the client a custom email notification (configurable in the Planner Portal).
- The email will:
- Notify the client a new Planning Report is available
- Prompt them to log into their portal
- Optionally suggest booking a Plan Review meeting
📂 Managing Multiple Reports
- You can create multiple reports for the same client (e.g., one for pre-meeting discovery and another post-meeting summary).
- Each report is saved and can be toggled or reviewed independently within the Plan Report section.
✅ Advisor Tips
- The ‘Base Scenario’ you select will automatically pull data points into the Plan Presets. If you would like another scenario to be the base scenario, you can select “Make Base Scenario” at the top of the Projections Section
- Customize sections to reflect your own planning process or compliance requirements.
- Include visuals and charts for maximum clarity and client engagement.
- Add Implementations to the Implementations Section and make that part of your Plan Review meeting. Highlight actions that need to happen over the next 1 - 5 years to show the value of ongoing planning
🛠️ Troubleshooting:
- How to Create a Report
- Report Presets
- Why Are the Charts Cut Off When Trying to Print Reports?
- How to Customize Reports Using Shortcodes
More help articles can be found here.
🚀 Implementation
This section provides a place to collaborate with clients on their to-do list. Add
🔄 How It Works
- Both planners and clients can create new implementations
- Planners can set due dates and have automatic reminders sent to clients
- Clients can share progress by clicking ‘Edit’ and adding notes to the ‘Progress’ section
✅ Advisor Tips
- Add future implementation goals to highlight the value of ongoing planning
🛠️ Troubleshooting:
More help articles can be found here.
📈 Tracking
The Tracking section allows clients to monitor how their real-world financial situation compares to your original financial plan — helping you stay on course or adjust as needed.
🔄 How It Works
- The platform always imports the Base Scenario for comparison
- You can select any scenario and set it as the Base using the ⭐ button
- When you click Import, the current year's plan is loaded into the tracking section
🧾 Entering Actual Balances
- Add actual account balances at the start of each year (e.g. January values)
- Optionally, enter monthly balances for more detailed tracking
- These inputs will populate the tracking chart to compare against the plan
📊 Visualizing Progress
- Compare planned vs. actual side by side
- Track up to three versions of the plan (e.g. 2022, 2023, 2024)
- See how actual performance aligns with or deviates from previous plans
✅ Advisor Tips
- Start with January values to get meaningful year-by-year comparisons
- Use this feature for annual reviews to assess progress and reset expectations
- Monthly tracking is optional but can be helpful for clients with volatile accounts
🛠️ Troubleshooting:
More help articles can be found here.
👥 Discovery Phase – Adding a Rental Property
If a client has a rental property that information is added to several of the Discovery Sections.
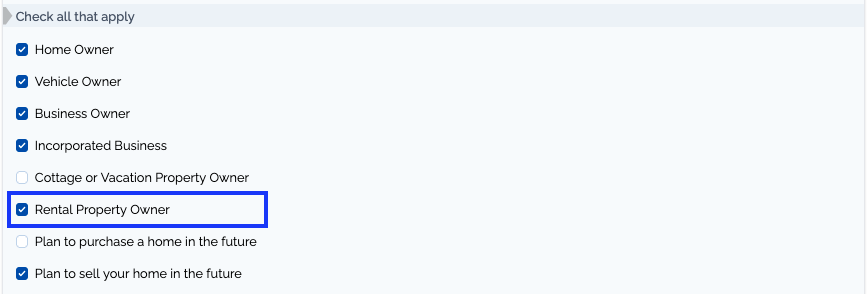
✅Enabling Rental Property
- Enabling Rental Properties: Ensure that the rental property field is enabled in the client’s profile. If they own rental properties, double-check that this is marked.
💰Income Section
- Enter Gross Rental Income: The gross rental income field allows clients to enter the rental income. This can be entered for each spouse if applicable, depending on ownership.
-
Add an Additional Income Snapshot: For retirement income, ensure that gross rental income is carried forward into the retirement income snapshot, so the planner can account for rental income past the client’s retirement age.
If the client plans to sell the property in the future, indicate the expected year of sale, or keep it in the plan if the property will continue generating income throughout retirement.
-
Net Rental Income: This is the gross rental income minus any deductible expenses (such as mortgage payments or rental property expenses).
Be sure that the client’s net cash flow accurately reflects income after expenses, including repairs, property taxes, and maintenance.
🧾Rental Property Expenses
- Expenses to Enter: In the rental property expenses section, ensure the following are entered:
- Mortgage payments
- Property taxes (choose from annual, quarterly, or monthly)
- Repairs and maintenance costs
- Other applicable deductible expenses
- Align Snapshots to Income: Expenses should be matched with the corresponding income periods to ensure alignment with the retirement projections.
🏠 Asset and Debt Information
- Property Value: Be sure to capture the original purchase price (or ACB—Adjusted Cost Base) of the property, including any capital improvements or repairs made.
- Rental Mortgages: If the client has a rental mortgage, ensure this is correctly marked as a rental property mortgage. This is important because the interest on this mortgage is tax-deductible.
- If the client used a home equity line of credit (HELOC) for a down payment or mortgage, make sure it is categorized properly as a rental mortgage to ensure the interest deduction is applied.
🧠 Advisor Tip:
- Add a Quick Rental: If the client doesn’t supply expenses, or you want to quickly add a rental without entering detailed information, you can do so by just entering the ‘Net Income’ to the Income section. This would be the net rental income after expenses (excluding mortgage payments). You can see how this is done in this video at the 33:45 mark.
🛠️ Troubleshooting:
- How to Set Up a Rental Property in Adviice
- What Do I Enter for Gross Rental Income?
- Is It Possible to Model Multiple Rental Properties?
- How to Model the Sale of a Rental Property?
- How Do I Model a Rental Property I Personally Use?
- How Do I Get Rid of 'Missing Rental Expenses on the Cash Flow Diagram?
- How Do I Get Rid of 'Missing Gross Rental Income on the Cash Flow Diagram?
More help articles can be found here.
🏠 Selling a Home
The Selling a House section can be used to model the sale of a rental property.
This section will be activated if the client indicates in their onboarding questions an intent to purchase a home in the future. If you would like to activate it manually you can do so in the Profile Section by clicking “Plan to purchase a home in the future”

🧾 What the Client Enters:
- Estimated sale price – This amount should match the value of the property listed in the Assets section.
- Estimated selling costs – Entered as a percentage of the sale price (e.g., realtor commissions, legal fees, staging, moving costs). A typical estimate might range from 4% to 6%.
- Sale date – Month and year when the sale is expected to occur. This is often timed alongside a new home purchase.
🧮 How the Platform Calculates:
- Net sale proceeds = Sale Price – Selling Costs (% of sale price)
- Proceeds will be available in the year of sale to support cash flow or a new property purchase.
- If there's a mortgage balance, this must be reflected in the Debt section of the plan and will reduce the final proceeds.
🧠 Advisor Tip:
- Confirm the adjusted cost base (ACB) has been entered correctly in the Real Assets section to support capital gains tracking.
- Selling a rental does not automatically pay off the mortgage. If there is an existing mortgage on the property this must be paid off manually in either the Debt Payoff Section or the Projections Section.
- Selling a rental does not automatically stop income and expenses. These should either be stopped through discovery snapshots or by entering manual overrides in the Projections Section.
🛠️ Troubleshooting:
More help articles can be found here.
🏘 Rental Property Analysis
The Rental Property Analysis section helps assess a rental property as an investment tool and how it contributes to long-term financial goals.
This section looks at the property on an annual basis, so make sure all inputs—rental income, expenses, and mortgage payments—are entered as annual amounts.
We break down the rental property into four key areas:
- Equity & Mortgage
- Rental Income
- Rental Expenses
- Rental Metrics
💰 Equity & Mortgage
This section calculates how much equity is tied up in the property and how much debt remains.
- Current Value – Pulled from the Discovery → Asset section
- Mortgage Debt – Remaining balance on the mortgage (and HELOC if applicable)
- Interest Rate & Annual Payment – Helps estimate carrying costs
📝 Tip: If there’s both a mortgage and a HELOC, combine them for total debt and annual payments.
📥 Rental Income
We assess all the income generated from the property:
- Gross Rental Income – Pulled from the Discovery → Income section
- Other Income – Laundry, parking, or other supplemental rental income
- Vacancy Rate – An estimate for time the unit isn’t rented (typically 3–5%)
This gives you the Total Annual Gross Income after accounting for vacancy.
📤 Rental Expenses
Monthly rental expenses (entered in Discovery → Expenses) are multiplied by 12 to calculate:
- Annual Operating Costs: Property taxes, repairs, condo fees, utilities, etc.
📊 Rental Metrics
These metrics help evaluate the performance and return on the rental property:
- Cash Flow
- Measures income after all expenses and debt payments
- Positive cash flow is ideal. Negative cash flow means the property must be subsidized.
- Cap Rate
- Measures return ignoring debt
- Formula: Net Operating Income ÷ Property Value
- Useful for comparing properties on an even footing
- Cash on Cash Return
- Measures return including debt payments
- Formula: (Cash Flow + Annual Mortgage Principal) ÷ Equity
- Shows how efficiently your equity is working
- Cash on Cash Return Including Appreciation
- Same as above, but assumes long-term property appreciation at the rate of inflation
- More optimistic, particularly if the property is highly leveraged
- As debt declines and equity grows, this number typically decreases over time
📝 Note: Appreciation and rental growth are assumed to match inflation over the long term.
✅ Advisor Tips
- Use this section to start conversations around:
- Is the rental helping or hurting cash flow?
- Is the return competitive compared to other investments?
- Could refinancing or selling the property unlock better outcomes?
- Anything greyed out is auto-calculated or pulled from the Discovery phase. Always confirm Discovery values are up to date.
👥 Discovery Phase – Income (with added Corporate Fields)
When a corporation is added, several new fields appear in the Income Section. These fields can be used to indicate Corporate Salary and Target Dividend.
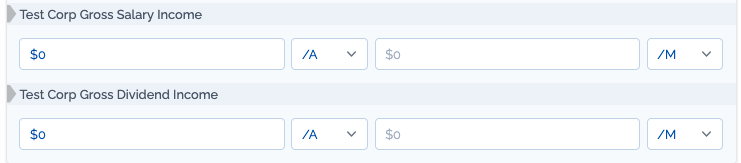
🧾 What the Client Enters:
- Salary drawn from corporation
- Dividend Income drawn from the corporation
🧠 Advisor Tip:
- Ensure Income Snapshots Continue: If your client is planning on continuing to drawdown corporate assets in retirement, ensure that dividend income is carried forward into the retirement income snapshot.
- Dividend Target: Dividend Income here is a target dividend, if the corporation is unable to fund this amount it will get as close as possible but not go into debt. This can be useful to find max available dividend in a given year or to model a corporate window in retirement
🏢 Corporate General Info Section
In this section, you’ll set up the core information for your client’s corporations to accurately reflect ownership, share value, tax implications, and corporate tax deduction limits.
💼 What’s Captured:
- Ownership structure of shares
- Share value and adjusted cost base
- Liquidation strategy (share sale or winding down)
- Small Business Deduction (SBD) limits
- Notional account balances related to dividend taxation
🧾 What the Client Enters:
- Ownership: Specify if shares are owned solely by one spouse, shared between spouses, or owned by an off-platform “other.” This affects tax treatment and net worth calculation.
-
Share Value: Enter the current value and adjusted cost base of shares. This impacts capital gains tax if shares are sold.
Note: Adviice does not automatically apply the lifetime capital gains exemption for CCPC shares. If applicable, enter this as a custom deduction in the Projection section.
- Liquidation/Dissolution Strategy:
- Share Sale: Selling the corporate shares and taxing the sale based on share value.
- Winding Down: Selling all corporate assets and distributing proceeds as salary/dividends.
- Small Business Deduction Limit: Enter the federal and provincial deduction limits for the CCPC’s active business income. This can vary depending on associated corporations.
- Notional Account Balances: These track refundable taxes and dividend payment limits:
- General Rate Income Pool (GRIP): How much can be paid as eligible dividends.
- Capital Dividend Account (CDA): Tax-free dividends from capital gains.
- Non-Eligible Refundable Dividend Tax on Hand (neRDTOH): Refundable tax related to non-eligible dividends.
- Eligible Refundable Dividend Tax on Hand (eRDTOH): Refundable tax related to eligible dividends.
🔍 Planning Considerations:
- Ownership and share value details strongly impact tax planning and personal net worth.
- Liquidation strategy affects the timing and nature of taxes on corporate assets.
- SBD limits must be accurate to avoid tax miscalculations.
- Notional accounts affect dividend tax planning and refunds—tracking these helps optimize cash flow.
🧠 Advisor Tip:
- If you’re Client is unsure about any corporate tax details, encourage them to consult with their accountant. Much of this information comes directly from the client’s T2 Corporate Tax Return.
- Use the Projections section to monitor notional account balances and plan dividend strategies accordingly.
🏦 Asset and Debt Information
This section captures the details your client enters about their corporate assets and debts, helping you review and verify a clear, detailed picture of their holdings and their tax impact.
💼 What’s Captured:
- Financial assets including adjusted cost base for capital gains
- Real estate and other real assets, classified by income type
- Corporate debts, including tax-deductibility and income source classification
🧾 What the Client Enters:
-
Financial Assets: Clients enter values as of the beginning of the year to avoid overestimating growth.They should include the adjusted cost base (ACB) for non-registered accounts so capital gains are calculated correctly.
Real Assets: Clients add real estate and other tangible assets by clicking the + Add New Assets button.
Each asset must be designated as either:
- Active Income (related to the business)
-
Passive Income (e.g., rental income)
Debt: Clients add corporate debts using the + Add New Debt button.
They must specify:
- Whether the debt is tax deductible
- Whether the deduction applies to active or passive income
🧠 Advisor Tip:
- Encourage clients to double-check adjusted cost base values to prevent tax calculation errors.
- If asset classification is unclear, advise consulting an accountant or reviewing corporate tax documents.
💰 Corporate Income & Expenses
This section captures future income and expenses for each corporation, as entered by your client. You will review this information to ensure it’s correctly classified and accurate, as it forms the basis for cash flow and tax projections.
💼 What’s Captured:
- Active income and expenses (business operations)
- Passive income and expenses (e.g., rental income)
- Separation of deductible and non-deductible expenses
- Manual overrides to update or correct default data
🧾 What the Client Enters:
- Active Income & Expenses:
- Salary amounts auto-populate from the Discovery > Income Section.
- Clients enter overrides for:
- Gross revenue
- Deductible and non-deductible expenses
Note: Overrides are entered by clicking on blue numbers, which turn red after editing.
Note: The platform calculates CPP and EI contributions based on salary data.
- Passive Income & Expenses:
- Clients enter gross rental or other passive income overrides.
- Deductible expenses related to passive income (excluding debt servicing costs) can also be overridden.
- Debt servicing expenses are not entered here; they are handled in the Corporate Assets & Debt Section.
- Scenario Editing: Clients can enter different income and expense figures for various scenarios by selecting from a dropdown menu at the top of the page.
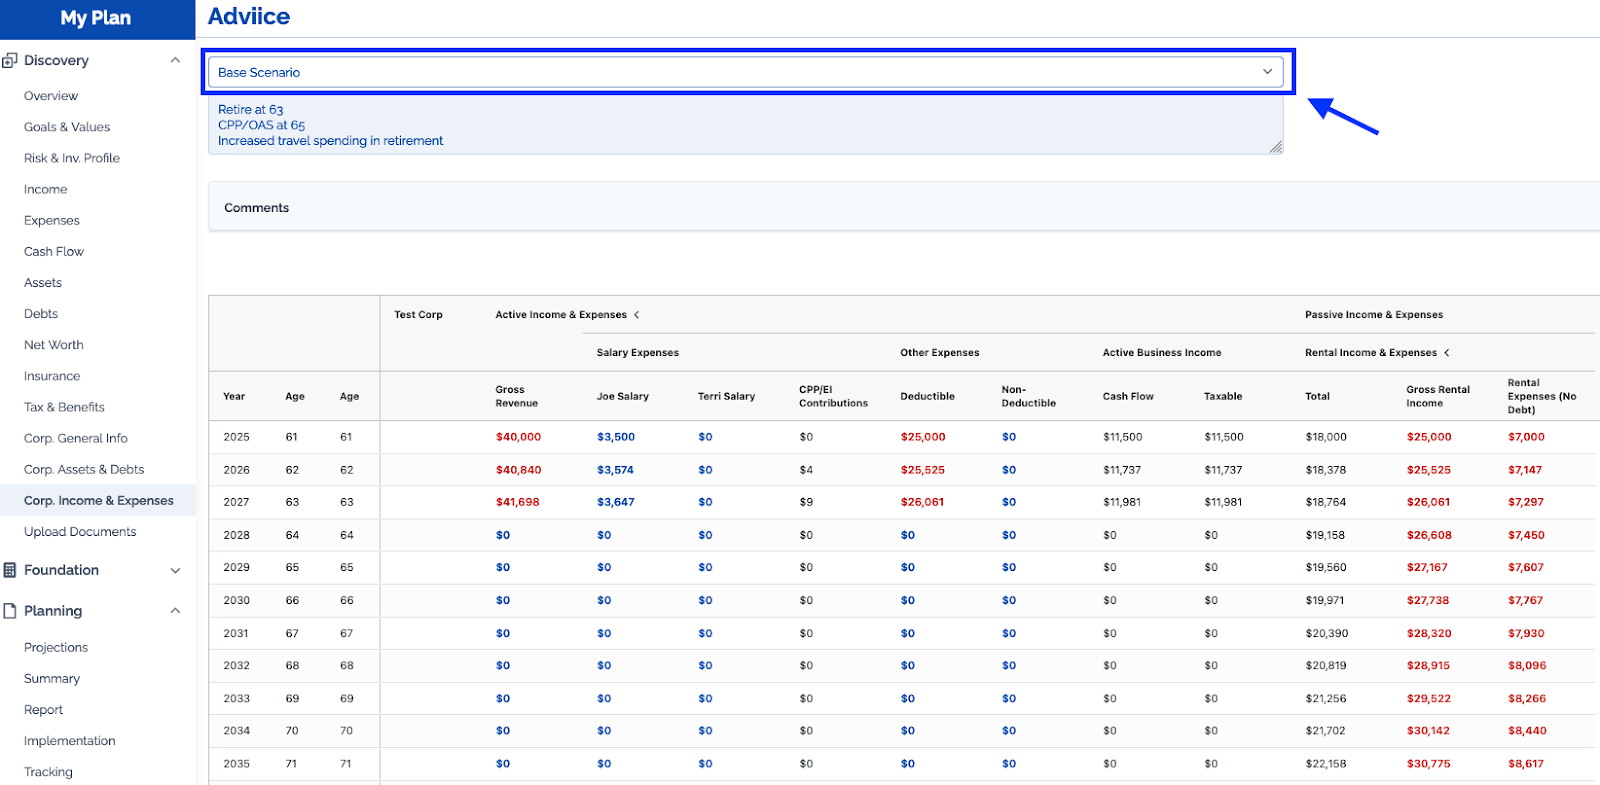
Note: All amounts entered are in future dollars, with inflation factored into projections.
🧠 Advisor Tip for Review:
- Verify that salary data auto-populated from the Income Section is consistent and reasonable.
- Review manual overrides (red numbers) for accuracy and completeness.
- Confirm correct classification between active and passive income and expenses.
- Ensure debt servicing costs are not included in passive expenses here.
🛠️ Troubleshooting:
More help articles can be found here.
🛡️ Corporate Insurance
In this section, you or your client will input the details of any corporately owned life insurance policies. These policies are typically used for estate planning, tax deferral, or to provide corporate liquidity at death.
💼 What’s Captured:
- Policy ownership (linked to one of the corporate owners)
- Death benefit (flat or increasing)
- Cash surrender value (CSV)
- Adjusted Cost Base (ACB)
- Annual premium
🧾 What the Client Enters:
The client will need to enter data directly from their insurance illustration. The platform does not estimate insurance growth — all values must be entered manually. Required fields include:
- Insured person (selected from corporate owners)
- Death benefit — either fixed or increasing over time
- Cash Surrender Value (CSV) — at various points in time
- Adjusted Cost Base (ACB) of the policy
- Annual Premium — this will reduce corporate cash flow
🔁 How the Platform Uses This Data:
- Annual premiums reduce corporate free cash flow
- CSV and ACB are used in liquidation or estate projections
- Death benefit is realized on death or wind-up, depending on strategy
⚙️ Planning Options You Can Model:
You can use scenarios to help clients test how the policy fits into their broader planning strategy.
📆 Option 1: Corporate Wind-Up Before Death
CSV and ACB are used in calculating the value on liquidation. This assumes the policy is surrendered prior to death.
⚰️ Option 2: Retain Policy Until Death
Death benefit is passed through the Capital Dividend Account (CDA) on death. This assumes the policy is held until death and the benefit is received by the estate.
💳 Option 3: Loan Against CSV
Model a loan secured by the policy’s CSV. Add a new corporate or personal debt entry and apply interest if needed. This loan can be repaid from the insurance proceeds at death.
🧠 Advisor Tip:
- Use scenarios to compare surrendering the policy versus retaining it to fund estate liquidity.
- Ensure that ACB and CSV are aligned with the values provided in the insurance illustration.
- The platform does not determine the optimal use of the policy — this must be evaluated by the advisor in client-specific contexts.
📍 Reminder:
Insurance values are not automatically inflated. Be sure the values reflect future year-end values where applicable. Use multiple entries if the death benefit or CSV increases over time.
🏢 Corporate Investment Plan
This section helps advisors model the investment strategy and tax impact of corporate assets by setting return assumptions, fees, and asset allocation for different types of corporate accounts.
🧾 Checking and Savings Accounts
These are typically low-return, low-risk accounts used for liquidity.
- Expected Return: Enter the long-term average return (e.g. 1.5%–2.5%)
- Fees: Add any applicable account fees
The platform uses these values to estimate net return over time
📈 Investment Accounts
For corporate investment accounts (e.g. brokerage accounts):
- Asset Allocation: Set your desired split between equities, fixed income, etc.
- Investment Fees: Input total MER or advisory fees
The platform applies a standard rate of return based on long-term market assumptions (from FP Canada), adjusted for fees
💰 Type of Return (Tax Treatment)
Each portion of the return can be categorized for tax purposes:
- Interest: Fully taxable
- Dividends: Eligible for dividend tax credit or refundable tax
- Capital Gains: Only 50% taxable, other 50% goes to CDA (Capital Dividend Account)
🧠 Advisor Tip:
- Long-term assumptions are used throughout the plan. You can override return assumptions in Projections > Advanced Options, but we recommend doing so only for special cases.